

Detecting Intrusions in Wireless Sensor Networks
Assessing security risks using data from WSNs.
1Overview & Strategic Importance

Problem Statement
Wireless Sensor Networks (WSNs) are crucial for various applications, including environmental monitoring, security, and surveillance. Ensuring the security of these networks is vital to prevent unauthorized access and data breaches. It is necessary to enhance the efficiency and effectiveness of intrusion detection systems, thereby reducing computational costs and improving overall network security.
Required Solutions
To address the problem of intrusion detection in WSNs, an automated system can be developed to predict the number of barriers needed for effective surveillance. Using factors like area, sensing range, transmission range, and the number of sensor nodes, the system can be implemented to quickly and accurately detect potential intrusions.
Solution Objectives
- Conduct exploratory data analysis.
- Build a prediction model to detect and prevent intrusion.
- Create an AI application to enable scenario-based analysis and optimization.
Understanding the Problem
Intrusion detection in Wireless Sensor Networks (WSNs) is a critical issue that arises due to the inherent vulnerabilities and constraints of these networks. WSNs consist of spatially distributed sensors that monitor and record environmental conditions, transmitting the collected data to a central location. The problem of intrusion detection involves identifying unauthorized access or malicious activities that could compromise the network's integrity, confidentiality, or availability. WSNs are particularly susceptible to intrusions due to their deployment in open and often unattended environments, limited computational resources, and reliance on wireless communication, which can be easily intercepted or disrupted. These factors contribute to the difficulty of maintaining robust security in WSNs, necessitating advanced and efficient intrusion detection systems.
Intrusions in WSNs can occur for several reasons, including physical tampering with sensor nodes, exploiting software vulnerabilities, or launching network-based attacks such as jamming, spoofing, or replay attacks. These intrusions can lead to severe consequences, such as data manipulation, unauthorized access to sensitive information, network disruptions, or even complete network failure. Traditional security mechanisms, like encryption and authentication, are often insufficient to address these threats due to the resource constraints of sensor nodes. Consequently, there is a need for sophisticated intrusion detection systems that can operate effectively within the limitations of WSNs. By leveraging machine learning techniques, researchers aim to develop predictive models that can identify potential intrusions based on patterns and anomalies in the network's operational data. The LT-FS-ID dataset, with its comprehensive set of features, provides a valuable resource for developing and testing such models, ultimately contributing to more secure and resilient WSN deployments.
2About the Data
Data Collection
There exist five columns in this dataset. The first four columns are features (i.e., area, sensing range, transmission range, number of sensor nodes), and the last column is the predictor or target variable (i.e., Number of barriers). This dataset is synthetically created through Monte-Carlo simulations.
Major Parameters Description
Download Training DataAreaTotal area of the region where the sensor network is deployed.
Sensing RangeMaximum distance a sensor can effectively detect objects or events.
Transmission RangeMaximum distance over which a sensor can transmit data to another sensor.
Number of Sensor NodesTotal number of sensors deployed within the network area.
Number of BarriersNumber of obstacles or barriers present in the sensor network area.
3Using iDareAI
Guided Mode Initialization
AUploading Dataset
Click on the **'Upload CSV or Excel Data'** button → Select a source for the dataset → Upload `network_intrusion_train.csv`. The system automatically analyzes the file, extracts column descriptions, and identifies the top value-adding targets for prediction.

BChoosing Analysis Mode
- How can barriers be set up to protect a wireless network system from external attacks?
- Which factors have the most impact on reducing the number of attacks on a wireless sensor network?
Operation Using Autonomous Guided Mode
AQuery Response
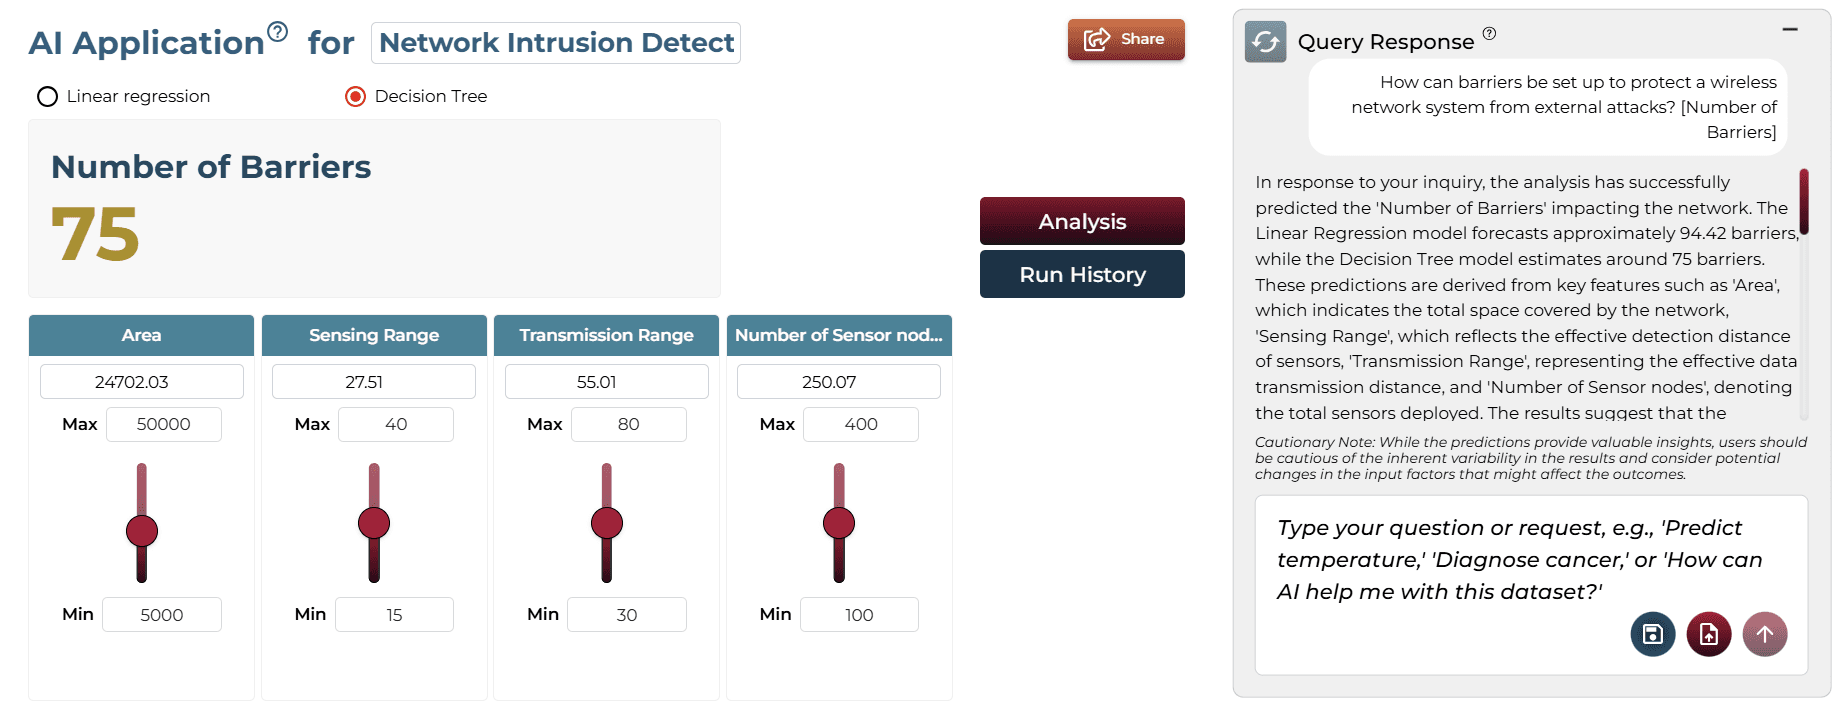
In response to your inquiry, the analysis has successfully predicted the 'Number of Barriers' impacting the network. The Linear Regression model forecasts approximately 94.42 barriers, while the Decision Tree model estimates around 75 barriers. These predictions are derived from key features such as 'Area', 'Sensing Range', 'Transmission Range', and 'Number of Sensor nodes'.
BAI Application
Running the query generates an on-demand AI application. Users can adjust sliders to test different scenarios and see real-time updates to predictions without technical knowledge.
Model Fine-Tuning/Manual Model Building
ASelecting Prediction Target
'Number of Barriers' was selected as the target column.

BSelecting Analysis Type
Since the target is numeric, 'Regression' is suggested and selected.

CSelecting Model Group/Item

DSelecting Features
Select Area, Sensing Range, Transmission Range, and Number of Sensor nodes.

ESelecting Training Level

FTraining
The training process uses advanced algorithms, including Xtreme Gradient Boosting, and Linear Regression. It applies 5-fold cross-validation with 80% of the data for training and 20% for testing on unseen data, ensuring robust and reliable predictions for predicting the chances of network intrusion. This setting prioritizes accuracy and thorough analysis over speed.
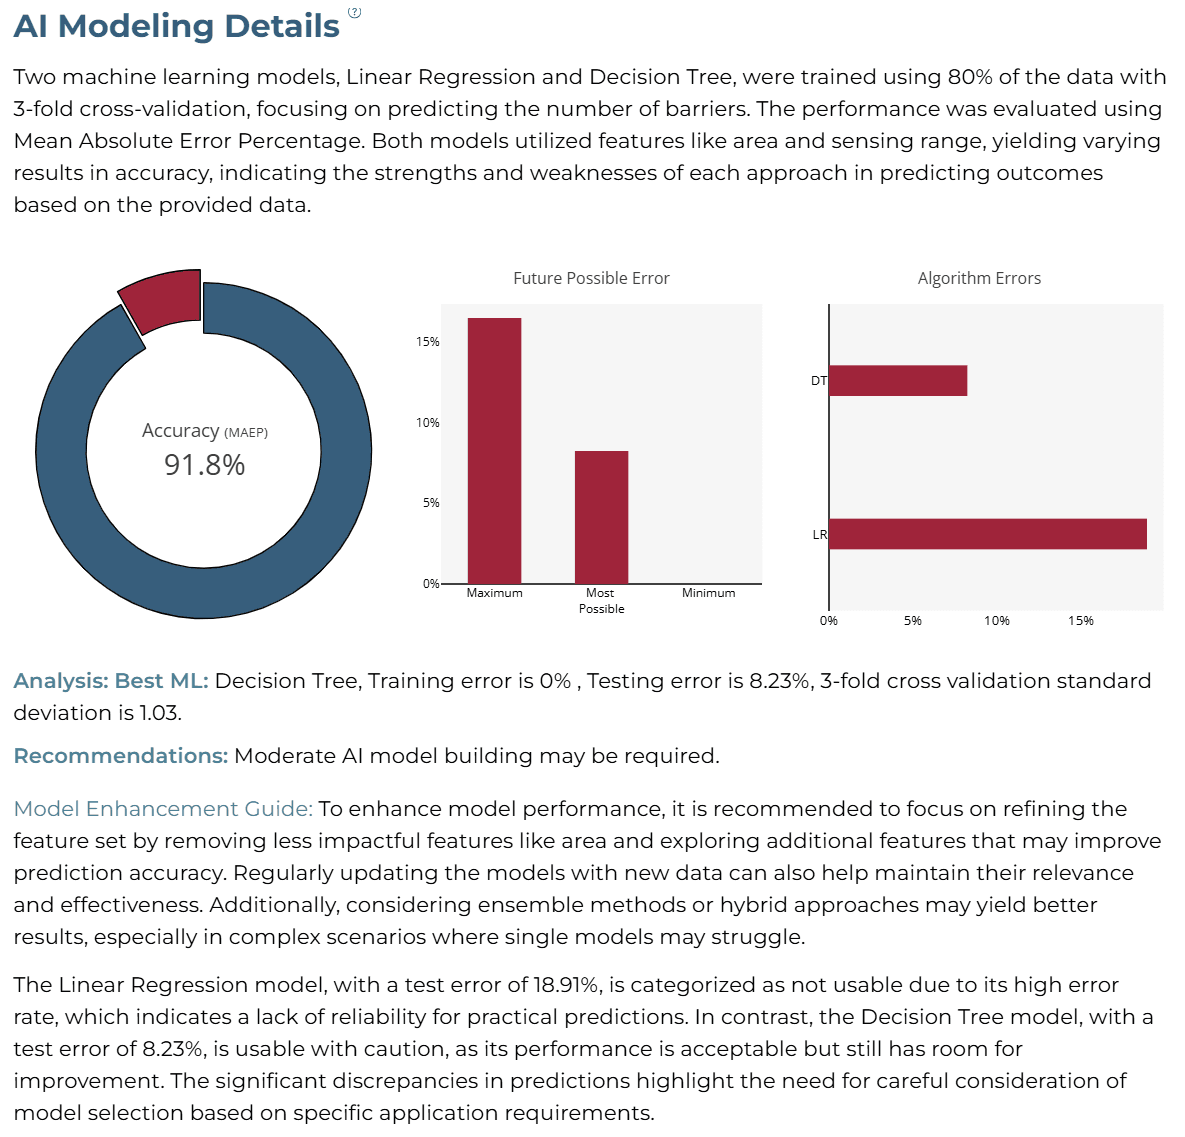
AI Modeling Details
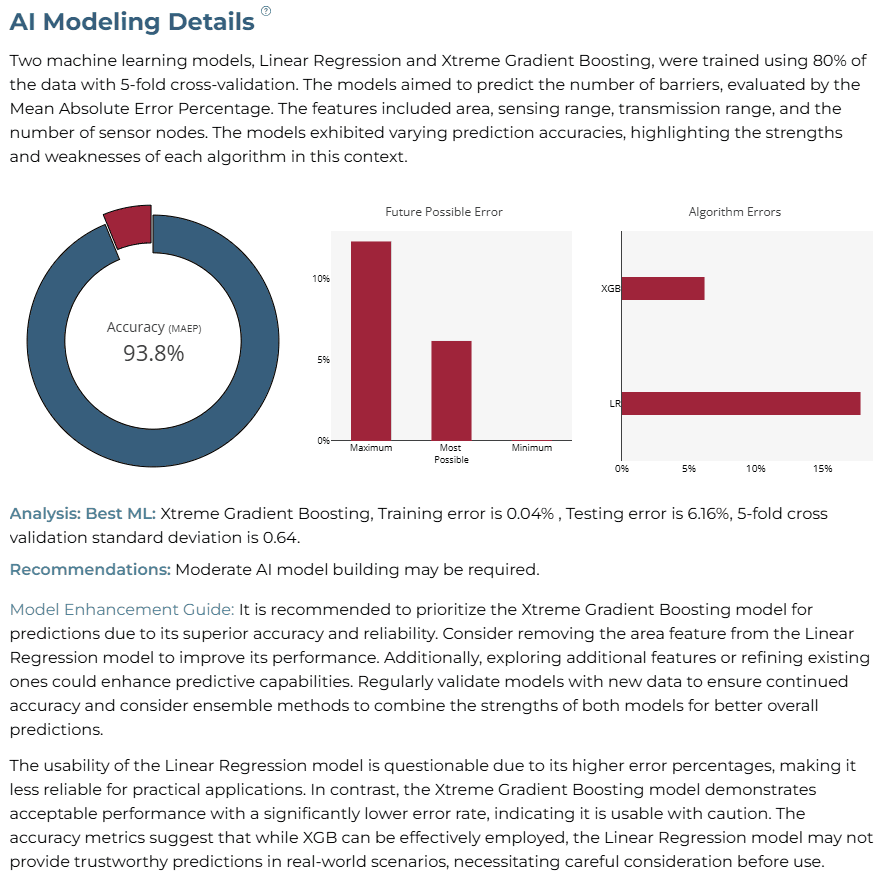
Two machine learning models, Linear Regression and Xtreme Gradient Boosting, were trained using five-fold cross-validation. The models aimed to predict the number of barriers based on key features such as area, sensing range, and transmission range. The Mean Absolute Error Percentage (MAEP) was used as the primary performance indicator to evaluate model effectiveness across training and testing datasets.
The results indicate that Xtreme Gradient Boosting demonstrated superior predictive performance, achieving a training error of 0.04% and a testing error of 6.16%. In contrast, Linear Regression exhibited higher error rates, suggesting it may not be as reliable for real-world applications. The standard deviation of the five-fold cross-validation process was 0.64, reflecting the model's consistency across different training splits.
Xtreme Gradient Boosting outperformed Linear Regression in accuracy and generalizability, making it the preferred model for this analysis.
Moderate AI model refinement may be required. It is advisable to prioritize Xtreme Gradient Boosting for enhanced accuracy and reliability. Removing "Area" from the feature set for Linear Regression may improve performance, as its negative importance could hinder predictions. Additionally, incorporating new features that capture environmental influences on sensing capabilities may further enhance model accuracy. Regular retraining with updated data is essential to maintain prediction effectiveness over time.
Training Analysis Details
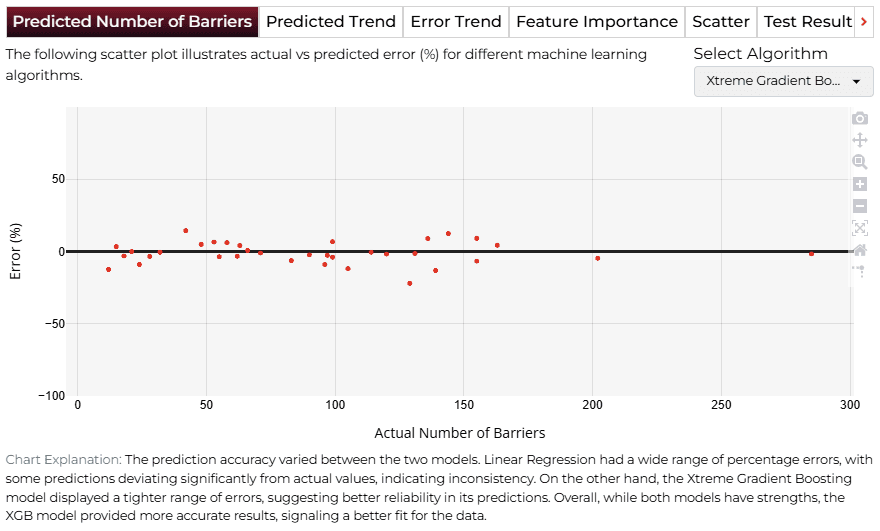
APredicted Number of Barriers
The first tab displays a scatter plot that compares predicted values against the actual number of barriers. This visualization highlights how well each model performed and points out areas with significant discrepancies. Xtreme Gradient Boosting (XGB) provided closer predictions with fewer errors, whereas Linear Regression showed larger deviations.
This scatter plot helps identify patterns such as consistent underestimation or overestimation. These insights can guide feature selection or predictor adjustments to improve model accuracy.
BPredicted Trend
The "Predicted Trend" tab provides a detailed view of how the predicted number of barriers aligns with actual observations over time. This includes separate lines for training data, actual test values, and test predictions. XGB followed the actual trends closely, whereas Linear Regression exhibited significant deviations, making it less reliable.
These trend comparisons help evaluate how effectively the models capture temporal patterns. Misalignments may indicate a need for further tuning or the inclusion of additional predictors.

CError Trend
The "Error Trend" tab provides insights into model consistency by plotting the Mean Absolute Error Percentage (MAEP) across iterations for both training and testing phases. XGB consistently performed well, maintaining stable cross-validation errors with minimal variation, while Linear Regression displayed higher error rates.
This error trend visualization is useful for identifying models that balance accuracy and consistency. While XGB proves to be a reliable choice, further optimization may enhance Linear Regression’s performance.

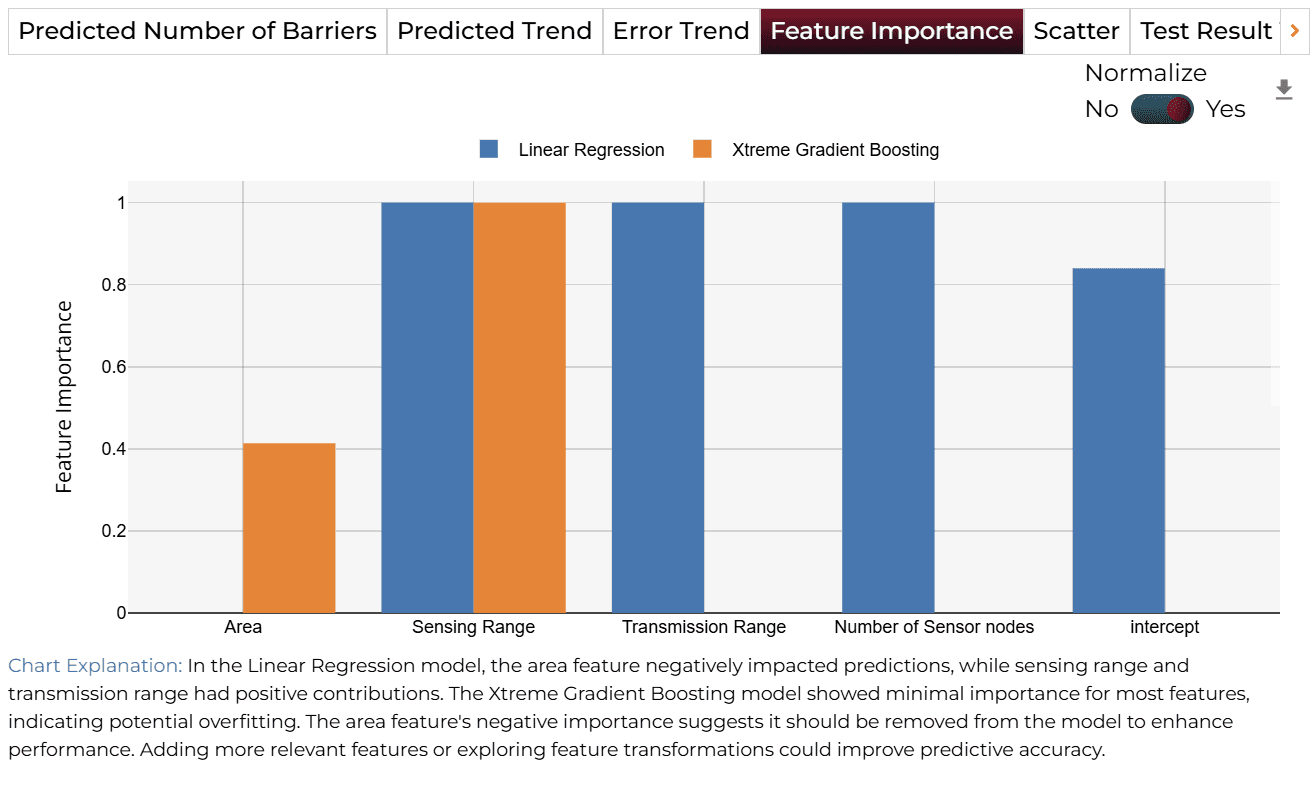
DFeature Importance
The "Feature Importance" tab ranks the influence of different predictors on the model's decision-making process. "Sensing Range" and "Transmission Range" were found to be the most significant features. In contrast, "Area" exhibited negative importance in Linear Regression, suggesting it may be detrimental to model performance.
Prioritizing impactful features such as "Sensing Range" and "Transmission Range" can enhance predictions. Removing or de-emphasizing less useful features like "Area" may help simplify the model and improve accuracy.
Finalize Models
Once satisfied with performance, click 'Deploy'. The system saves and deploys models for future demand analysis or production environment.

4AI APPLICATION
Manual Model Building
In Manual Training Mode, the query response dynamically adapts to the values selected for features in the AI Application interface. Users can manually adjust sliders or select specific variables (e.g., Area, Sensing Range, Transmission Range, or Number of Sensor Nodes) to configure the predictors. By clicking ‘Get Response,’ the system generates a tailored analysis that directly reflects the user’s input.
For example, if features like 'Sensing Range' and 'Transmission Range' are emphasized as key predictors, the system will highlight their impact on barrier estimation, showcasing their role in defining the number of barriers required. Similarly, changes to other features, such as 'Number of Sensor Nodes' or 'Area,' will dynamically modify the results, ensuring that the analysis aligns with the customized inputs provided by the user.
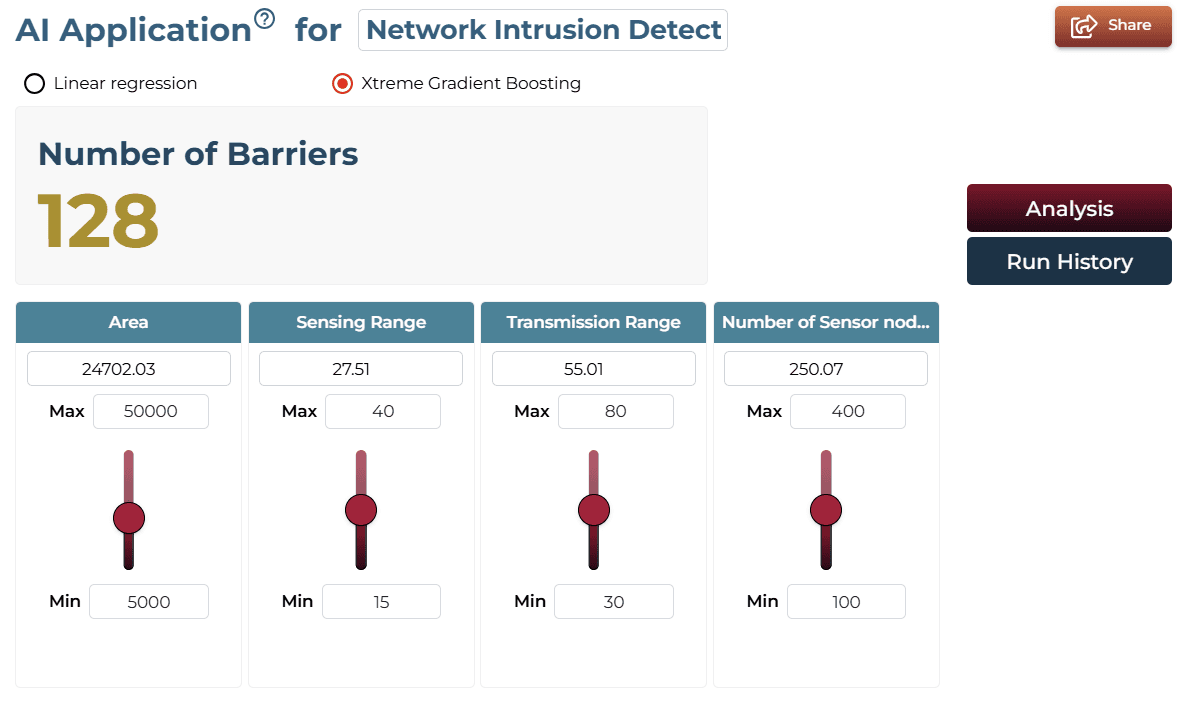
AI Application Demo
- The initial states of the features display a predicted number of barriers in the target section.
- Using the slider, increase the 'Area' feature.
- The predicted number of barriers in the target section will change, reflecting how spatial expansion influences barrier requirements based on the adjusted feature values.
Saving the Project
Save your project by clicking the icon at the bottom left corner of the textbox.

Sharing the Project
Share the application for single on-demand predictions once the analysis is saved.

Interested in similar AI solutions?
Explore our full suite of AI capabilities designed to transform your business operations.