

Diagnosing Component Failure in Power Distribution Transformers
Ensure reliable power distribution with advanced transformer component failure diagnosis.
1Overview & Strategic Importance

Problem Statement
Power Supply Companies face high costs in maintenance and service interruptions due to transformer failures and unplanned trips. A distribution transformer is critical for converting high voltage into usable voltage levels (e.g., 240/120 V) for electric power distribution. However, these transformers are prone to failure due to various internal and external factors.
Such failures can lead to severe power outages, operational disruptions, and increased costs. The most significant and catastrophic failure instances include Mechanical Failure, Dielectric Failure, and Electrical Winding Short Circuits.
The Magnetic Oil Gauge (MOG_A) is a critical indicator of transformer health, monitoring oil levels that can signify potential issues. Understanding how MOG_A readings relate to failures can provide vital early warnings, allowing maintenance teams to act proactively. The challenge is to predict these failures with at least 48 hours of lead time, ensuring sufficient time for corrective actions and minimizing operational risks.
Required Solutions
- Diagnose component failures with a low rate of false alarms.
- Provide early warnings of potential failures, giving operators at least 48 hours to act.
- Predict the failure probability of critical components in real time.
- Monitor indicators such as oil level, oil temperature, and other key parameters using ML models.
Solution Objectives
- Perform exploratory data analysis to identify failure patterns.
- Determine the probability of Magnetic Oil Gauge (MOG) failure.
- Perform scenario analysis to understand the impact of various operational parameters.
- Enable actionable insights for proactive maintenance planning.
Understanding the Problem
Understanding the functionality and components of a transformer is essential for its effective operation and maintenance. Transformers comprise several critical parts, including the oil tank, conservator, Buchholz relay, breather unit, oil indicator, temperature detector, pressure relief device, thermal relay, radiator, and bushing, each serving a specific role in ensuring the transformer’s performance and safety.
The oil tank houses the transformer windings, immersing them in oil to facilitate cooling and insulation. Above the oil tank, the conservator allows the oil to expand and contract with changes in temperature, ensuring consistent cooling even under varying loads. The Buchholz relay, used when a conservator tank is present, is a crucial safety device. It detects issues such as low oil levels or improper oil flow between the main tank and the conservator, providing early warning of potential failures.
The breather unit contains silica gel to absorb moisture from the oil. The gel changes color from blue to pink when saturated, indicating reduced moisture absorption capacity. The oil indicator complements this by showing the oil level within the conservator, allowing operators to monitor and maintain optimal levels. Meanwhile, the temperature detector monitors the oil’s temperature, disconnecting the transformer if the temperature exceeds safe limits to prevent overheating. Similarly, the pressure relief device mitigates the risk of explosions by releasing excess pressure from within the transformer.
A key device for monitoring oil levels is the Magnetic Oil Gauge (MOG), which indicates the insulating oil level in the conservator. As a mechanical device, the MOG is critical for identifying oil leaks or reductions in oil levels, which could signal potential issues such as leaks or oil loss. Proper monitoring of the MOG helps ensure the transformer's reliability and prevents failures caused by insufficient oil levels.
2About the Data
Data Collection
This data is collected via IoT devices from June 25th, 2019, to April 14th, 2020 which was updated every 15 minutes. It contains various operational parameters monitoring the health of distribution transformers.
Major Parameters Description
Download Training DataVL1Voltage of Phase Line 1.
VL2Voltage of Phase Line 2.
VL3Voltage of Phase Line 3.
IL1Current of Line 1.
IL2Current of Line 2.
IL3Current of Line 3.
VL12Voltage between Line 1 and Line 2.
VL23Voltage between Line 2 and Line 3.
VL31Voltage between Line 3 and Line 1.
3Using iDareAI
Guided Mode Initialization
AUploading Dataset
Click on the **'Upload CSV or Excel Data'** button → Select a source for the dataset → Upload `transformer_failure_train.csv`. The system automatically analyzes the file, converts it into feature data, and identifies prediction targets.
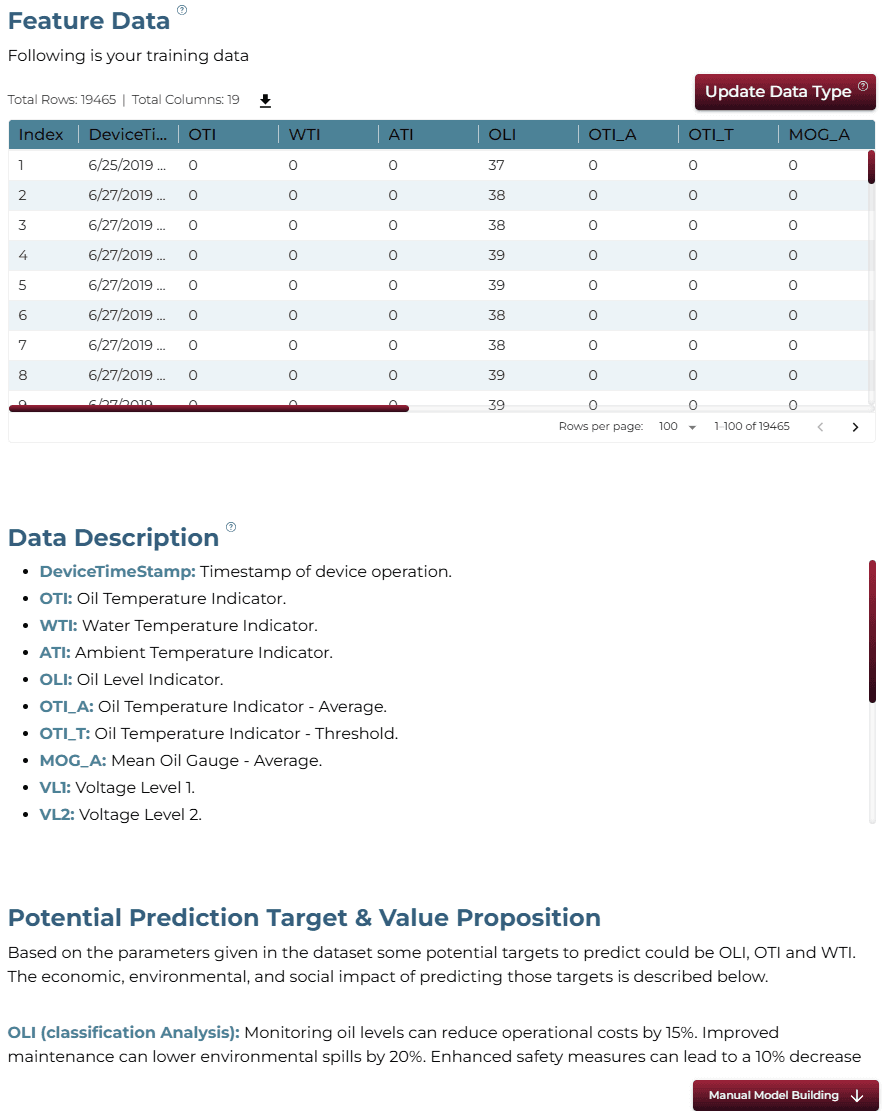
The system automatically analyzes the uploaded file, converting it into feature data. It extracts descriptions and identifies the top value-adding targets for prediction, highlighting the economic, social, and environmental impacts.
BChoosing Analysis Mode
Note: In autonomous model building mode, the training process begins by asking a question such as:
- Which factors best predict whether a transformer is likely to fail or not? (MOG_A, Classification)
- What are the most significant factors influencing the likelihood of transformer failure? (MOG_A, Classification)
- How do load and temperature affect the chances of transformer failure? (MOG_A, Classification)
The autonomous system processes the query, analyzes the data, and automatically generates a model along with a detailed response. In contrast, manual building mode provides full control over the model-building process, allowing technical users to experiment with different configurations.
Operation Using Autonomous Guided Mode
The system automatically performed the predictive analysis by itself, returned the query response, and built an automated AI application on-demand.
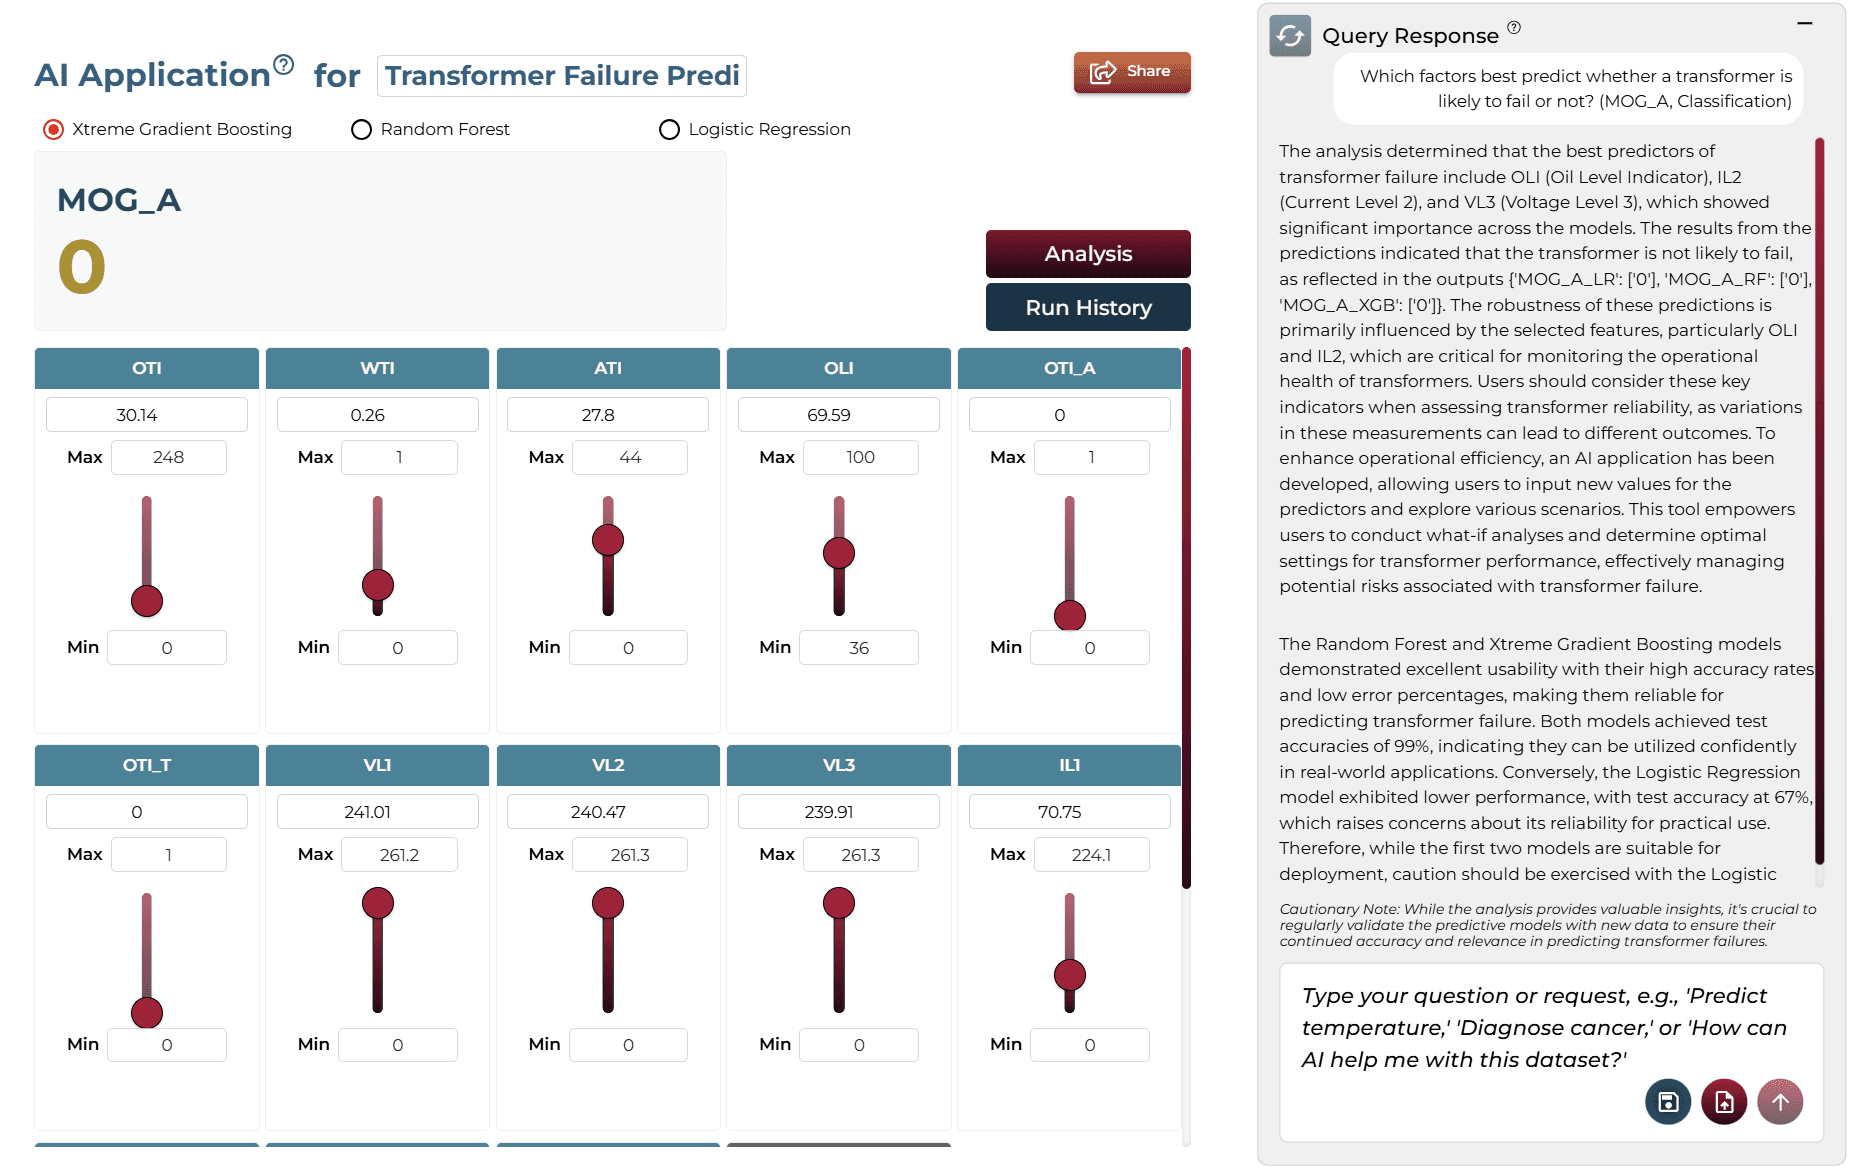
AQuery: “Which factors best predict whether a transformer is likely to fail or not? (MOG_A, Classification)”
BQuery Response
The analysis determined that the best predictors of transformer failure include OLI (Oil Level Indicator), IL2 (Current Level 2), and VL3 (Voltage Level 3). Predictions showed that the transformer is not likely to fail, as reflected in the outputs 'MOG_A_LR' ['0'], 'MOG_A_RF': ['0'], 'MOG_A_XGB': ['0']. The robustness of these predictions is primarily influenced by critical monitoring features like OLI and IL2.
The Random Forest and Xtreme Gradient Boosting models demonstrated excellent usability with 99% accuracy scores, making them reliable for real-world applications. Conversely, the Logistic Regression model achieved 67% accuracy, suggesting caution for practical use.
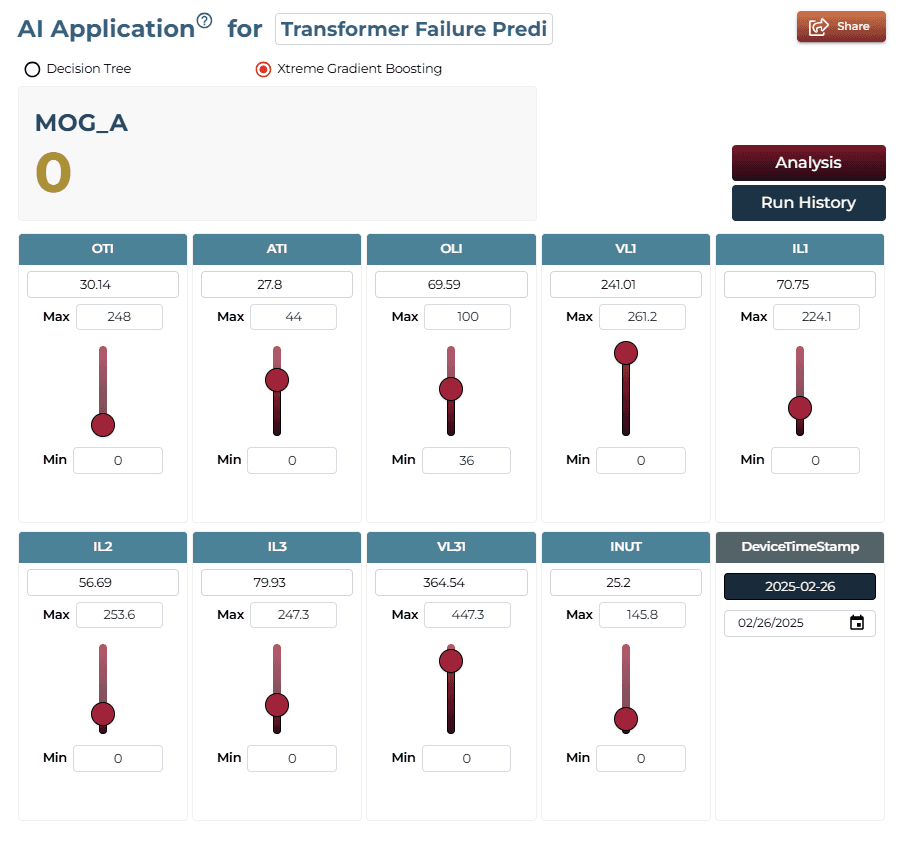
CAI Application
In automated mode, running the query solves the problem for you step by step and generates the AI application. The figure shows the application designed to help users make predictions based on various inputs. Users can choose between multiple models for generating predictions. The interface includes sliders that allow users to adjust key variables and see how changes impact the predicted outcome. This dynamic system lets users test different scenarios and explore insights without requiring technical knowledge.
Model Fine-Tuning/Manual Model Building
Manual model building allows users to take full control of the model creation process by guiding them step-by-step through data preparation, feature selection, algorithm configuration, model training, and validation.
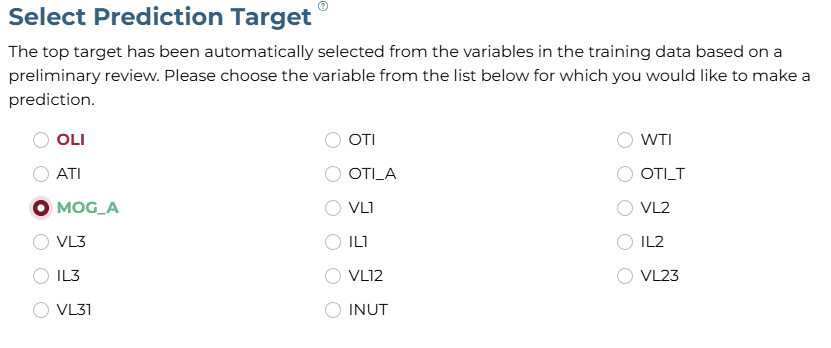
ASelecting Prediction Target
Analyzing the automated response, the 'MOG_A' column was selected as the target.
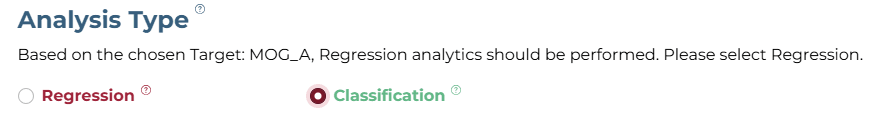
BSelecting Analysis Type
The analysis target is numeric with two values (0 and 1), so 'Classification' is selected.
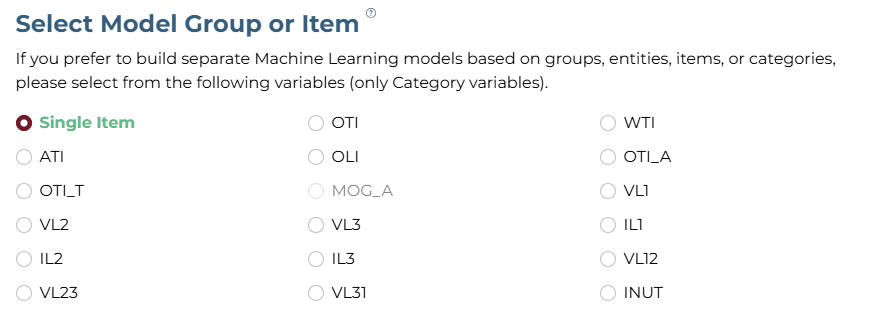
CSelecting Model Group/Item
The group-wise models divide the dataset into subsets to train separate ML models for each unique group or item value. No item/group is required for this dataset.
DSelecting Features
The interface allows you to customize the features used in the predictive analysis by selecting or deselecting any number of variables from the provided list. While the system has automatically recommended up to 10 features based on the selected target and solution type, you are not restricted to these. Using your domain knowledge, you can choose the most relevant features by checking or unchecking them, tailoring the model to better align with the problem you are solving.
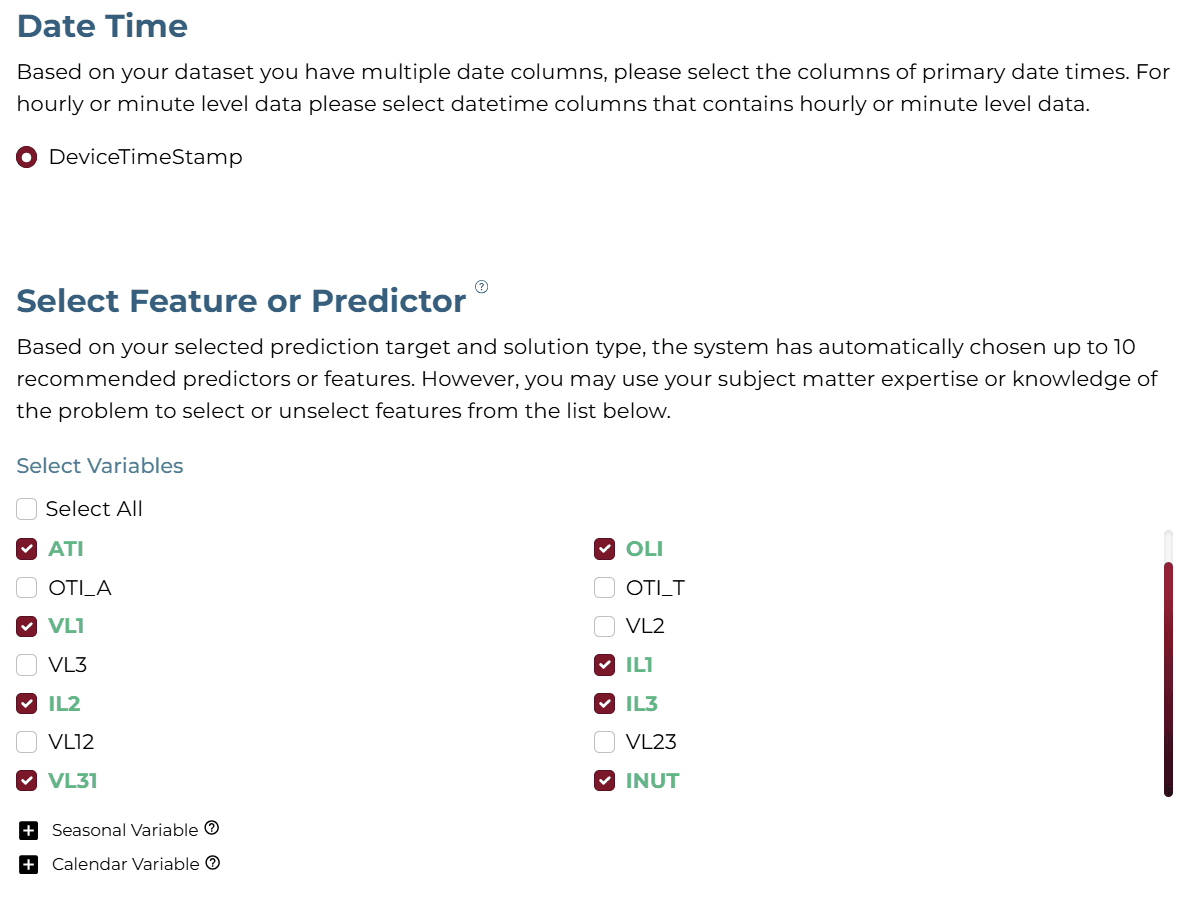
Select the following features: OTI, ATI, OLI, VL1, IL2, IL3, VL31, INUT, IL1.
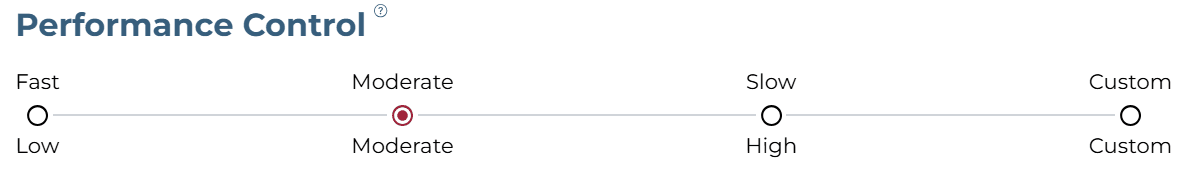
ESelecting Training Level
After the target to be predicted, analysis type, and features/predictors/variables are selected, the training process can be started. The Moderate Training Level and Performance configuration was selected for this example.
FTraining
The training process uses advanced algorithms, including Xtreme Gradient Boosting, and Decision Tree. It applies 5-fold cross-validation with 80% of the data for training and 20% for testing on unseen data, ensuring robust and reliable predictions. This setting prioritizes accuracy and thorough analysis over speed.
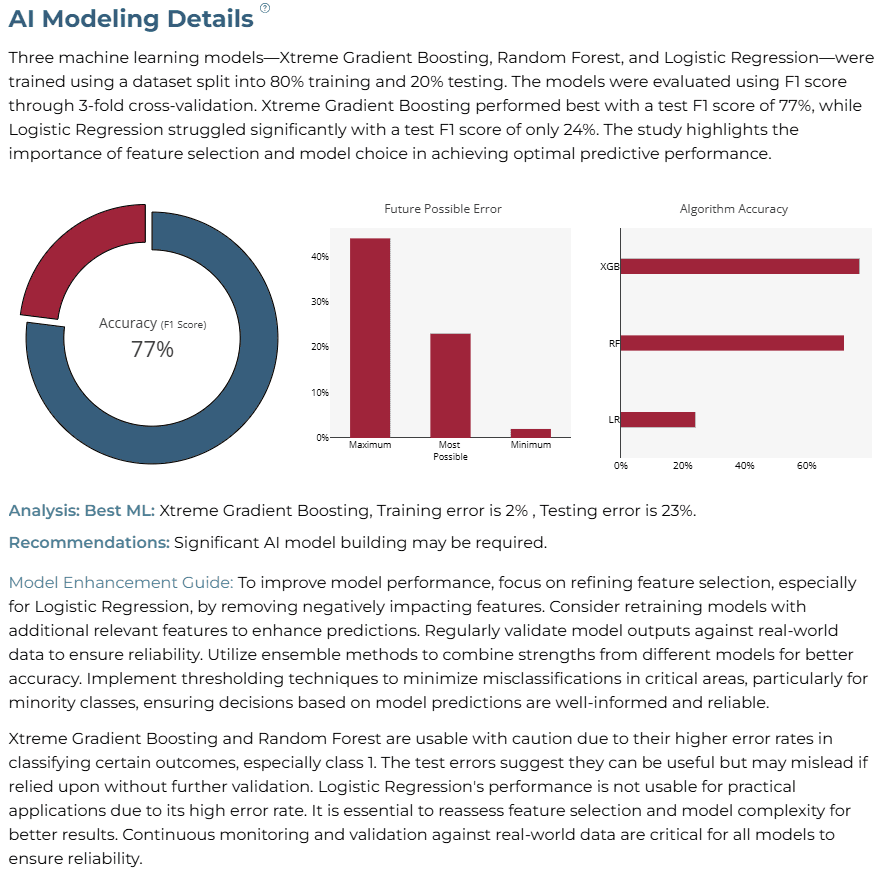
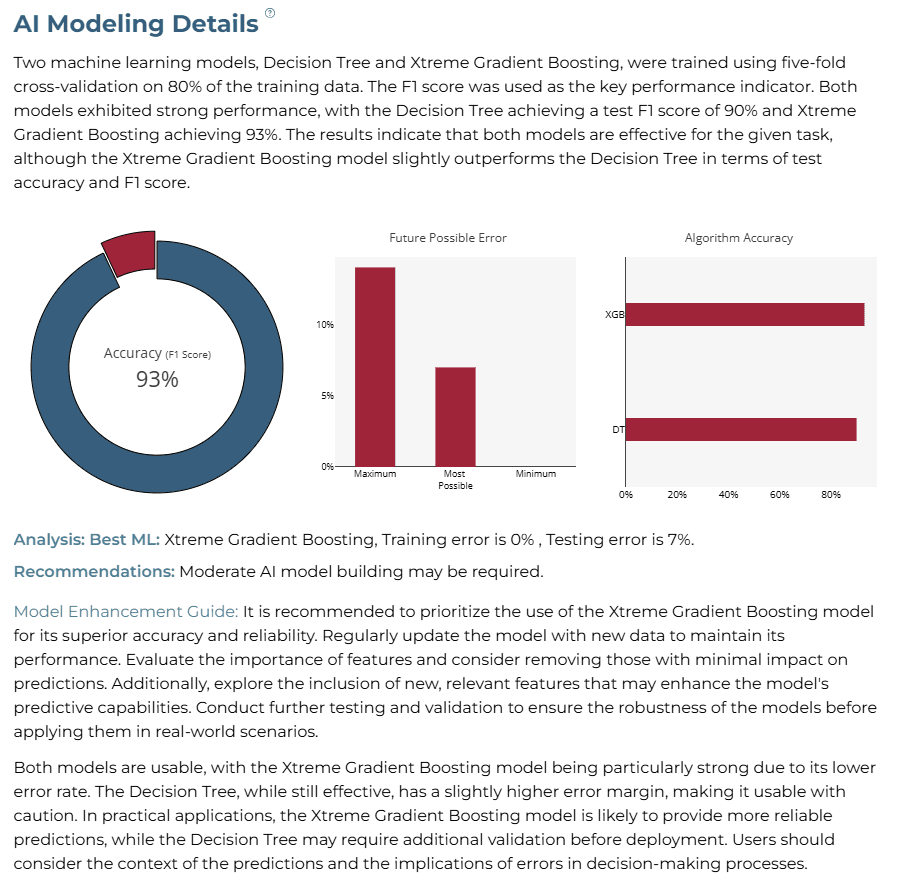
AI Modeling Details
Xtreme Gradient Boosting achieved superior performance with a training error of 2% and a testing error of 7%, demonstrating high generalization capability for predictive maintenance.
Training Analysis Details
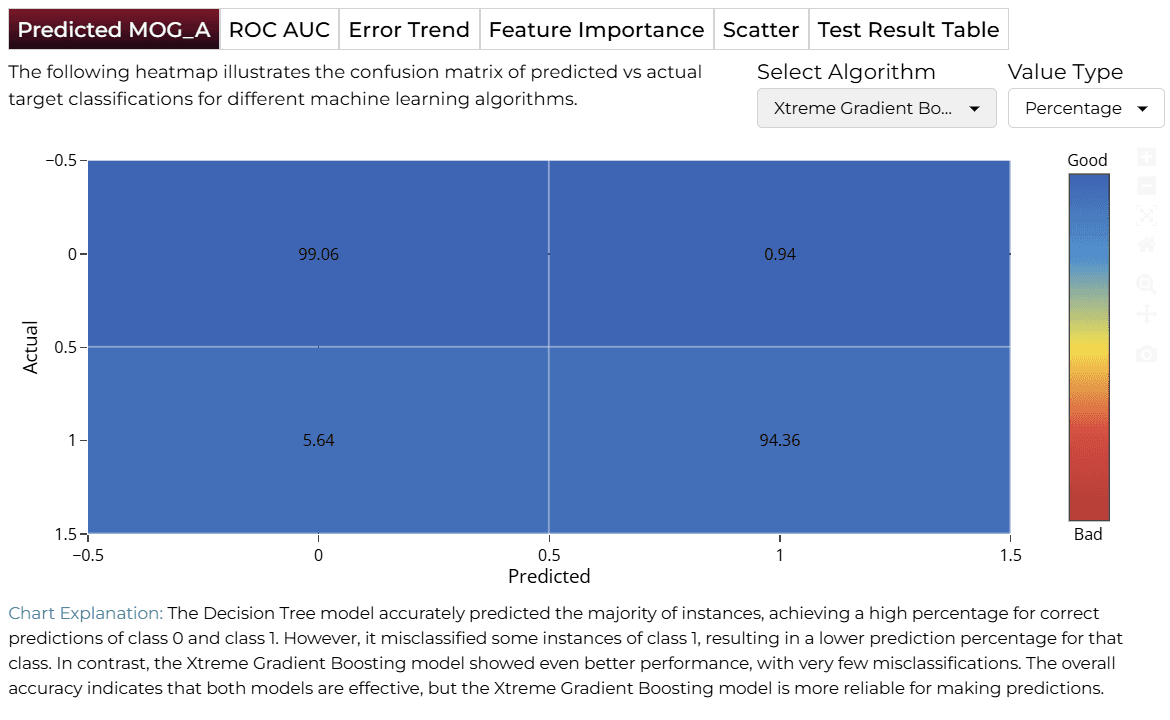
APredicted Target (Confusion Matrix)
The confusion matrix highlights correct classifications in blue. Xtreme Gradient Boosting effectively minimizes incorrect predictions compared to the Decision Tree model.
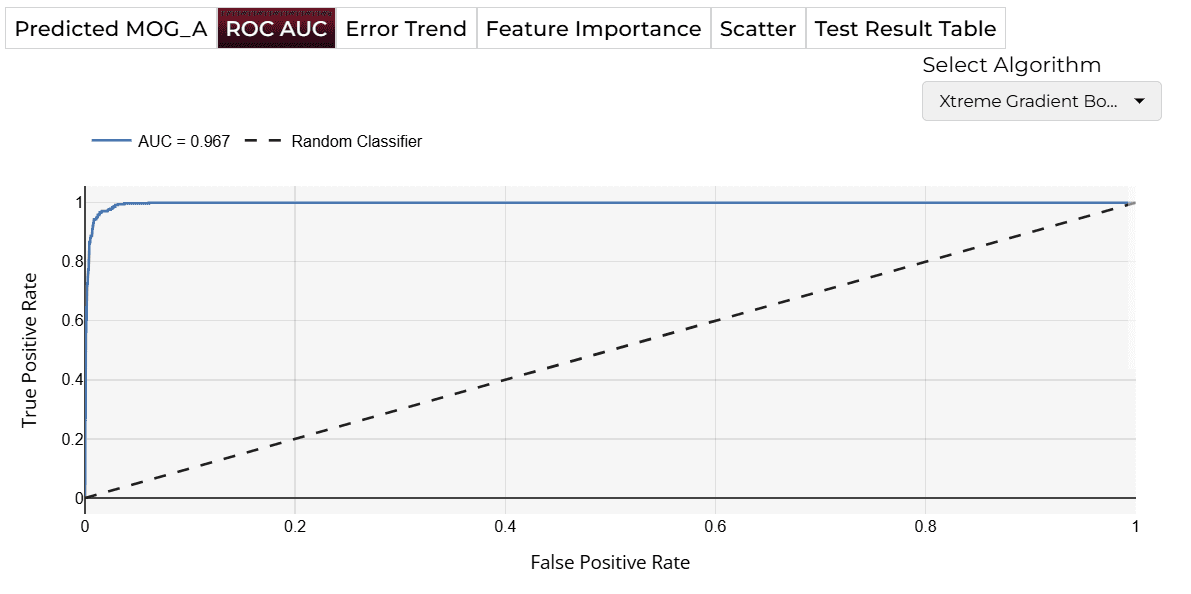
BROC AUC Curve
With an AUC score of 0.967, the XGB model demonstrates strong predictive capabilities in distinguishing between classes (alarm on/off).
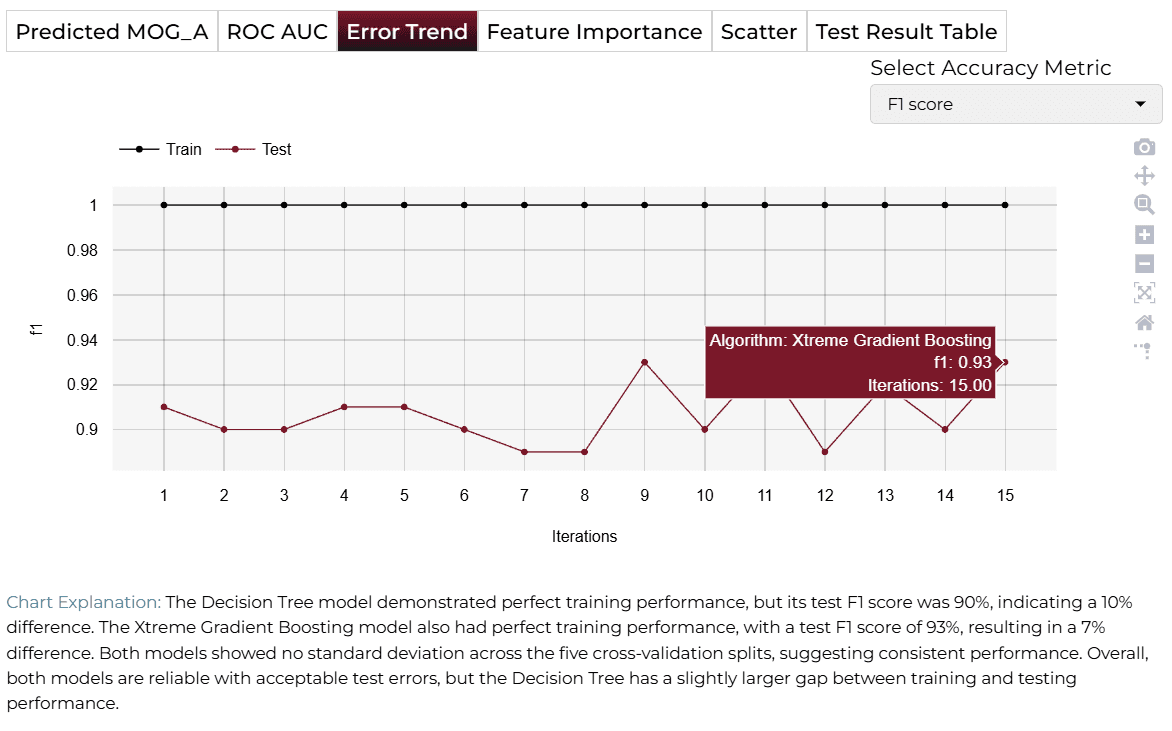
CError Trend
Tracks the F1 score over cycles. XGB shows stable performance across training and test data, while Decision Tree exhibits signs of overfitting.
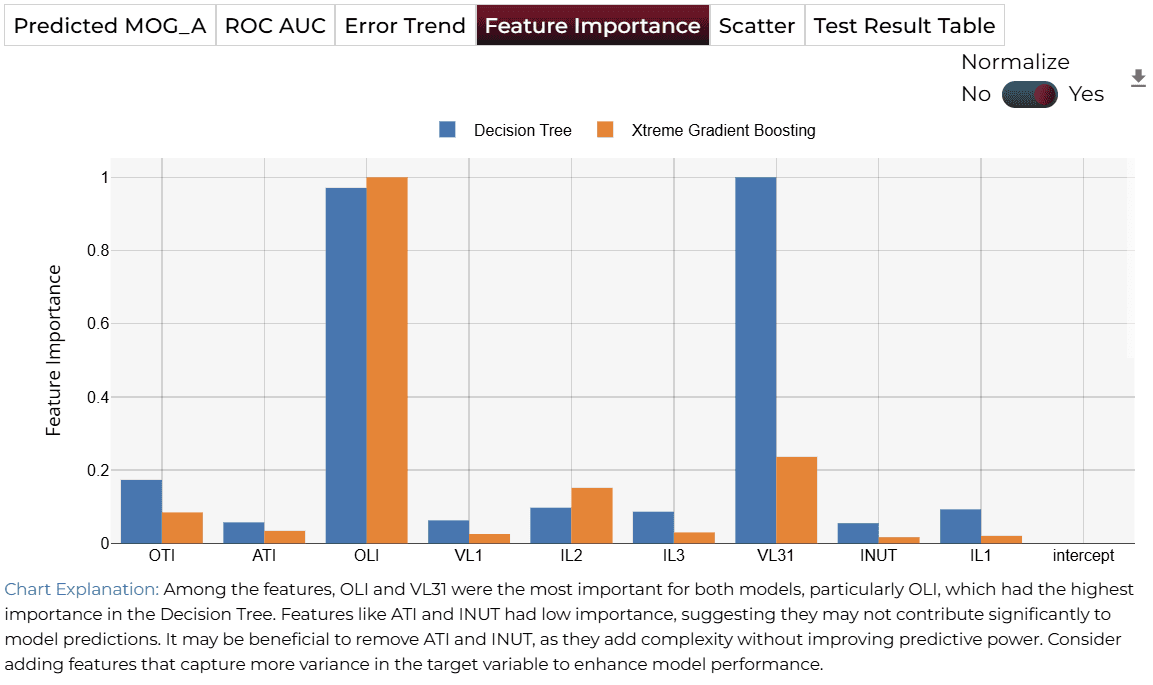
DFeature Importance
OLI and VL31 are identified as the most influential features for predicting transformer failure.
Finalize Models
Once you are satisifed with the performance of your selected ML model(s), click on the 'Deploy' button. In this case, the system will save the selected and trained model(s) and deploy them for future demand analysis or batch predictions for production environment.

4AI APPLICATION
Manual Model Building
In the Manual Training Mode, the query response dynamically adjusts to the values selected for the features in the AI Application interface. Users can manually modify the sliders to explore different predictor values and assess their impact on the Mean Oil Gauge (MOG_A) prediction. Key features such as Overall Temperature Indicator (OTI), Wind Temperature Indicator (WTI), and Voltage Level (VL2) play a crucial role in determining MOG_A values.
AI Application Demo
- The initial feature values set the baseline MOG_A value displayed in the output section.
- Adjusting the OLI slider to higher values.
- The predicted MOG_A value remains stable, reflecting that the current conditions align with baseline expectations.
Saving the Project
The interface allows you to save the AI analysis. For this purpose, you have to save your project by clicking on the icon at the bottom left corner of the textbox.

Sharing the Project
The system also allows sharing the application for single on-demand predictions accessible to anyone once the analysis is saved.

Interested in similar AI solutions?
Explore our full suite of AI capabilities designed to transform your business operations.