

Predicting CO Emissions from Gas Turbine Generators
Predicting the amount of Carbon Monoxide gas emitted by a gas turbine generator to take cautionary measures.
1Overview & Strategic Importance

Problem Statement
A powerplant engine (gas turbine) is mainly used to generate electricity. Since the engine can use different types of fuels, it may result in different levels of CO2 and NO emission of gases. Assessing the amounts of CO and NOx will support GHG emission control programs and help achieve net zero emission goals.
Required Solutions
- Predict CO emissions in real-time based on available real-time data.
- Identify optimal operational conditions to minimize CO emissions while maintaining efficiency.
Solution Objectives
- Conduct exploratory data analysis to identify key predictors of GHG emissions.
- Develop a predictive model to estimate greenhouse gas emissions accurately.
- Create an AI application to enable scenario-based analysis and optimization.
Understanding the Problem
Greenhouse gas (GHG) emissions are a major contributor to global climate change. Accurate prediction and real-time monitoring are critical for effective mitigation strategies. Traditional methods are often time-intensive and costly.
Recent advancements in machine learning offer innovative approaches for predicting emissions with high accuracy, leveraging features like energy consumption, operational pressure, and temperature.
2About the Data
Data Collection
This study used a dataset from a gas turbine (GT) located in Turkey’s Northwestern region. The dataset contains 36,733 samples of eleven sensor measurements collected from 2011 to 2015.
Major Parameters Description
Download Training DataATAmbient temperature in degrees Celsius (°C).
APAmbient pressure in millibars (mbar).
AHAmbient humidity in percentage (%).
AFDPAir filter difference pressure in millibars (mbar).
GTEPGas turbine exhaust pressure in millibars (mbar).
TITTurbine inlet temperature in degrees Celsius (°C).
TATTurbine after temperature in degrees Celsius (°C).
CDPCompressor discharge pressure in millibars (mbar).
TEYTurbine energy yield in megawatt-hours (MWH).
3Using iDareAI
Guided Mode Initialization
AUploading Dataset
Click on the **'Upload CSV or Excel Data'** button → Select a source for the dataset → Upload `ghg_emission_train.csv`. The system automatically analyzes the file, converting it into feature data and identifying prediction targets.

BChoosing Analysis Mode
Choose between autonomous machine learning (ML) or customized model building. In autonomous mode, the training begins by asking a question such as "How much CO emission can we expect based on the provided data?".
Operation Using Autonomous Guided Mode
AQuery: “How much CO emission can we expect based on the provided data?”
BQuery Response
Based on the provided data, we can expect CO emissions to be approximately 1.84 to 2.38 ppm. The Random Forest model yielded the most reliable estimate of 1.9 ppm. This prediction is influenced by key features such as ambient temperature and turbine inlet temperature.
CAI Application
The system generates an automated AI application on-demand. Users can adjust key variables using sliders to see real-time impacts on emissions.

Model Fine-Tuning/Manual Model Building
ASelecting Prediction Target
The 'CO' column was selected as the target based on the problem statement.

BSelecting Features
Selected features include AT, AP, AH, AFDP, GTEP, TIT, TEY, TAT, CDP, and NOX.

CSelecting Training Level
Custom Training Level with Linear Regression, Random Forest, and LightGBM was selected.

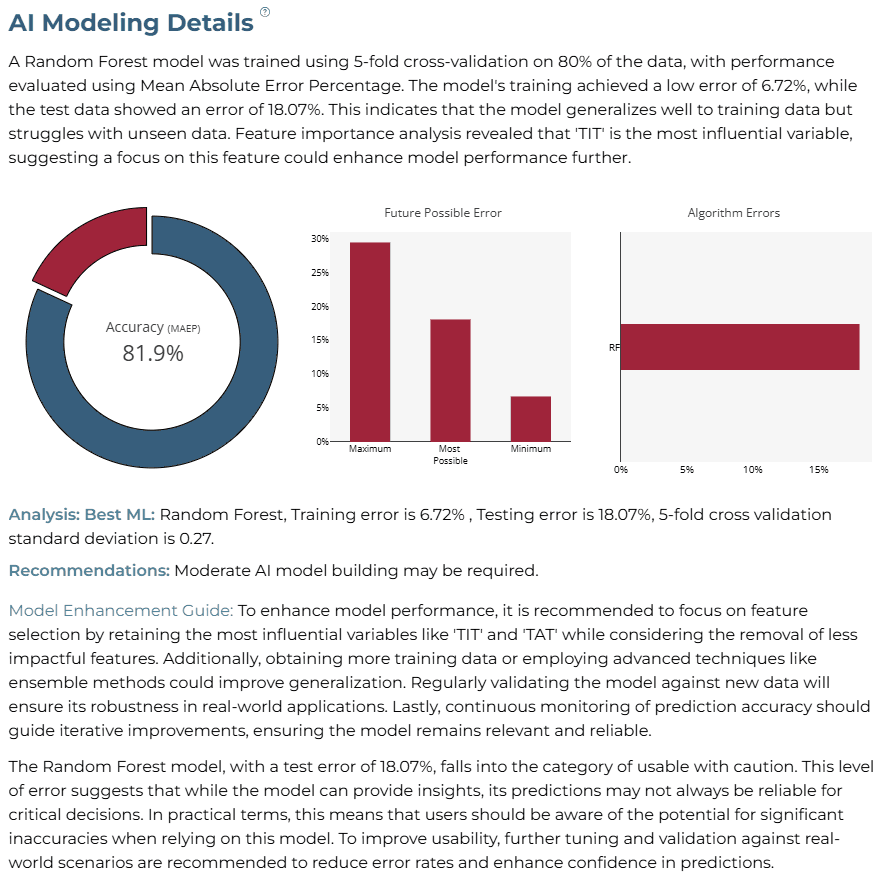
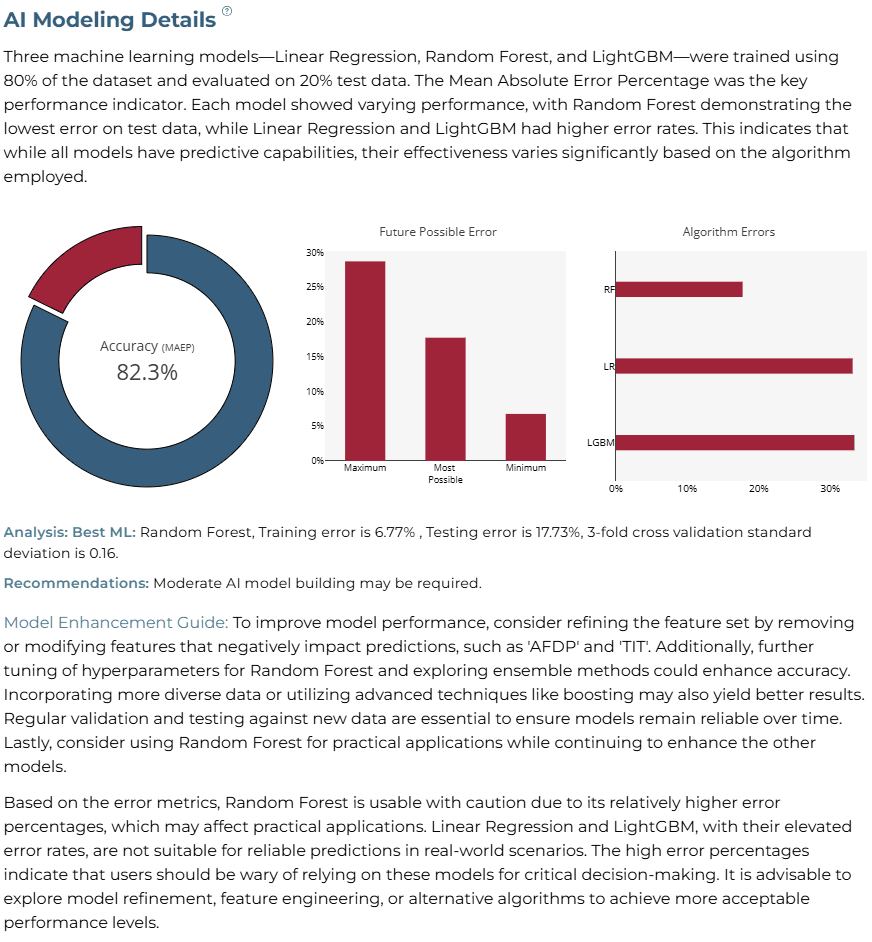
AI Modeling Details
Three models were trained using 80% of the dataset. Random Forest demonstrated the best performance with a training error of 6.77% and testing error of 17.73%.
Training Analysis Details
APredicted CO
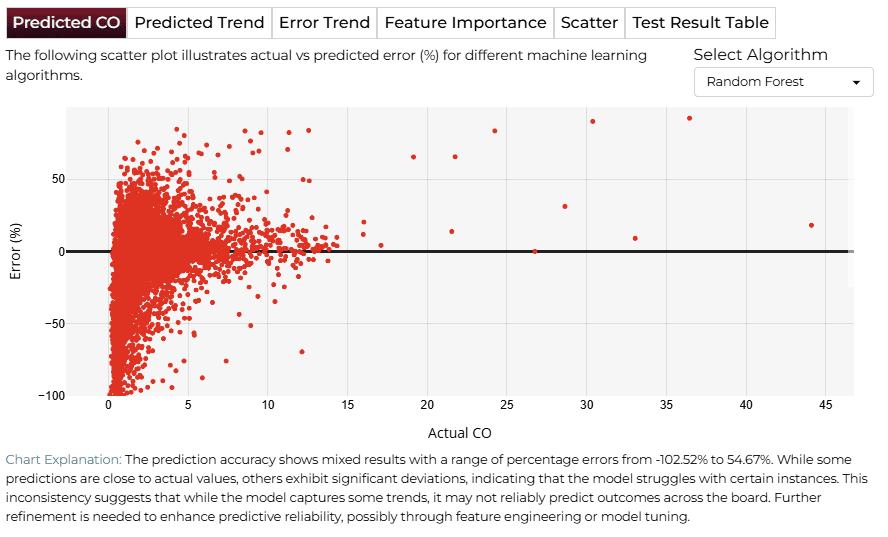
BPredicted Trend

CError Trend

DFeature Importance

Finalize Models
Once satisfied with the performance, click 'Deploy' to save and deploy the model for future predictions in a production environment.

4AI APPLICATION
Manual Model Building
Allows users to manually adjust predictor values such as TIT and TAT to see real-time updates in CO emission predictions.

Saving the Project
Save your AI analysis by clicking the icon at the bottom left corner of the textbox.

Sharing the Project
Share the application for single on-demand predictions once the analysis is saved.

Interested in similar AI solutions?
Explore our full suite of AI capabilities designed to transform your business operations.