

Predicting Defect Status in Manufacturing Processes
Detecting product defects to ensure quality control and optimize manufacturing processes.
1Overview & Strategic Importance

Problem Statement
Defect rates in manufacturing significantly impact production costs, operational efficiency, and customer satisfaction. High defect rates result in increased waste, rework, and delays, undermining profitability and competitiveness. Using comprehensive datasets related to production metrics, supply chain quality, and workforce productivity, we aim to predict the likelihood of high defect occurrences, enabling proactive measures to minimize defects and optimize manufacturing operations.
Required Solutions
- **Defect Rate Prediction**: Build a model to predict `DefectStatus`.
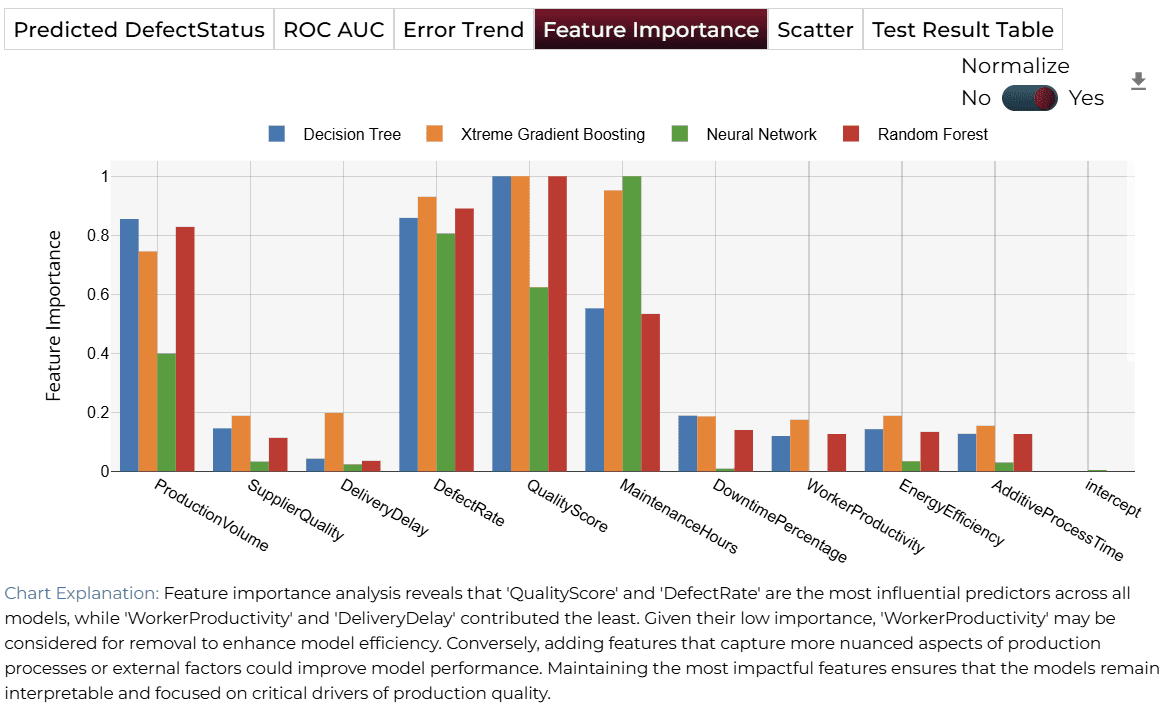
- **Feature Importance**: Identify critical factors contributing to high defects.
- **Optimization Strategies**: Provide actionable insights to reduce defects.
- **Imbalance Handling**: Address data imbalance for high performance.
Solution Objectives
- Analyze key production and operational metrics influencing defect rates.
- Build a binary classification model to predict high defect occurrences (DefectStatus).
- Provide recommendations to improve production quality based on feature analysis.
Understanding the Problem
Defects can stem from inconsistent supplier quality, inadequate maintenance, or workforce inefficiencies.
By leveraging data-driven insights, manufacturers can identify high-risk areas and implement preventive measures to reduce costs and waste.
2About the Data
Data Collection
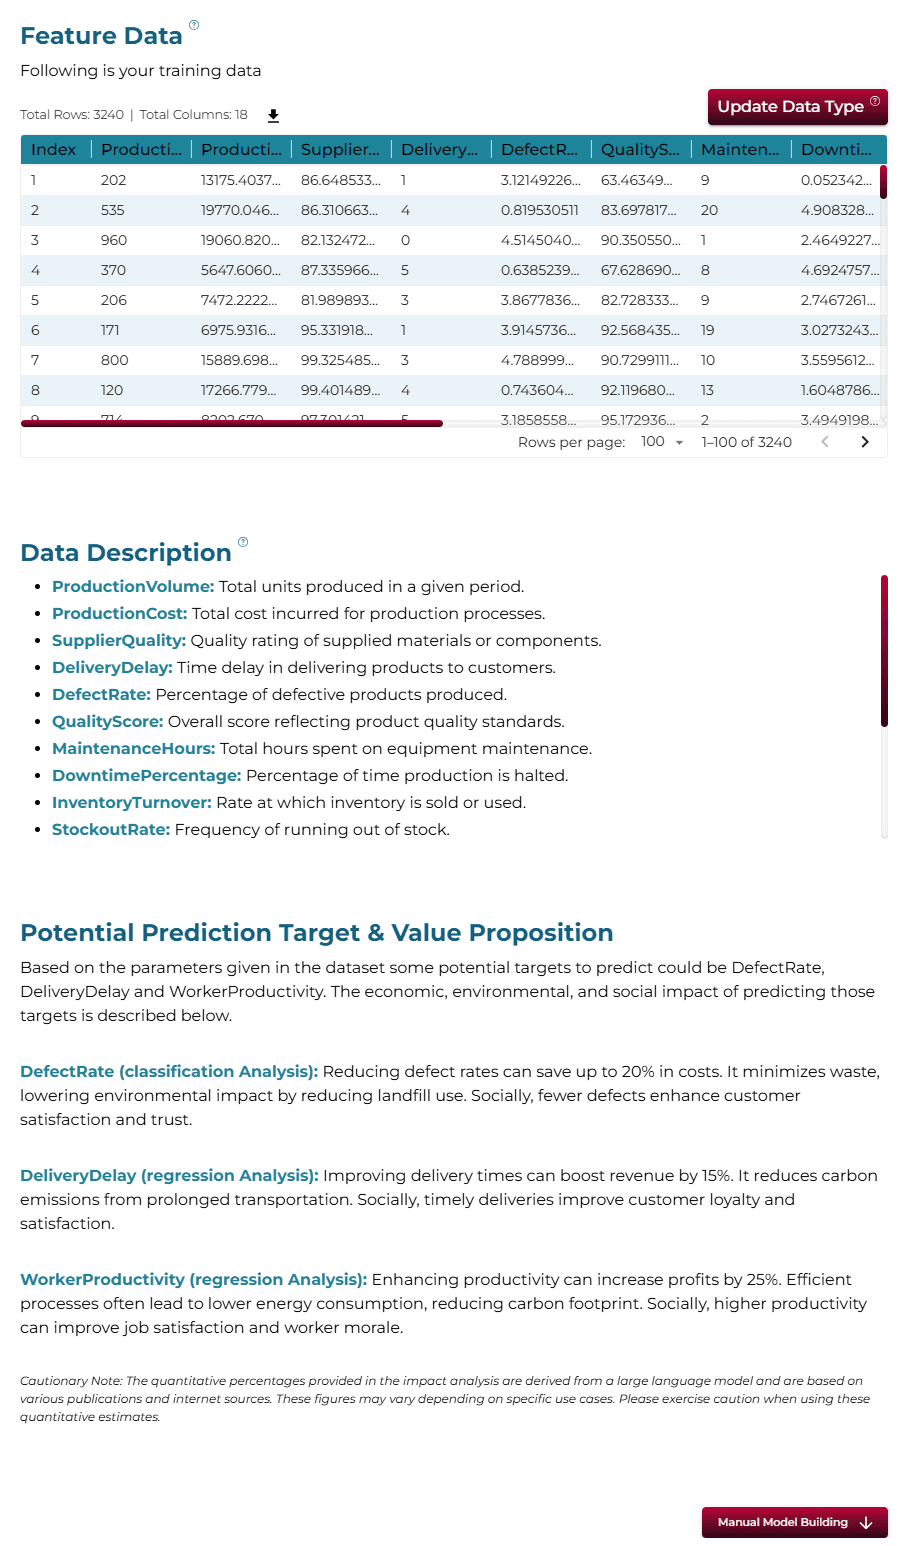
The dataset consists of records from a manufacturing environment, capturing metrics related to production operations, supply chain logistics, maintenance, inventory, and energy usage.
Major Parameters Description
Download Training DataProductionVolumeNumber of units produced per day (100–1000).
ProductionCostCost incurred for production per day ($5000–$20000).
SupplierQualitySupplier quality ratings (80%–100%).
DeliveryDelayAverage delivery delays (0–5 days).
DefectRateDefects per thousand units (0.5–5.0).
QualityScoreOverall quality assessment (60%–100%).
MaintenanceHoursHours spent on maintenance per week (0–24 hours).
DowntimePercentagePercentage of production downtime (0%–5%).
InventoryTurnoverRatio of inventory turnover (2–10).
3Using iDareAI
Guided Mode Initialization
AUploading Dataset
Click on the **'Upload CSV or Excel Data'** button → Select a source for the dataset → Upload `defect_detection_train.csv`. The system automatically analyzes the file, extracts column descriptions, and identifies the top value-adding targets for prediction.
BChoosing Analysis Mode
- What changes can ensure low defects based on the patterns in this data?
- Which factors in the data have the biggest impact on high defects?
Operation Using Autonomous Guided Mode
AQuery Response
The analysis revealed that 'MaintenanceHours', 'QualityScore', and 'ProductionVolume' are the most significant factors. Specifically, increased maintenance hours showed a strong correlation with lower defect rates.
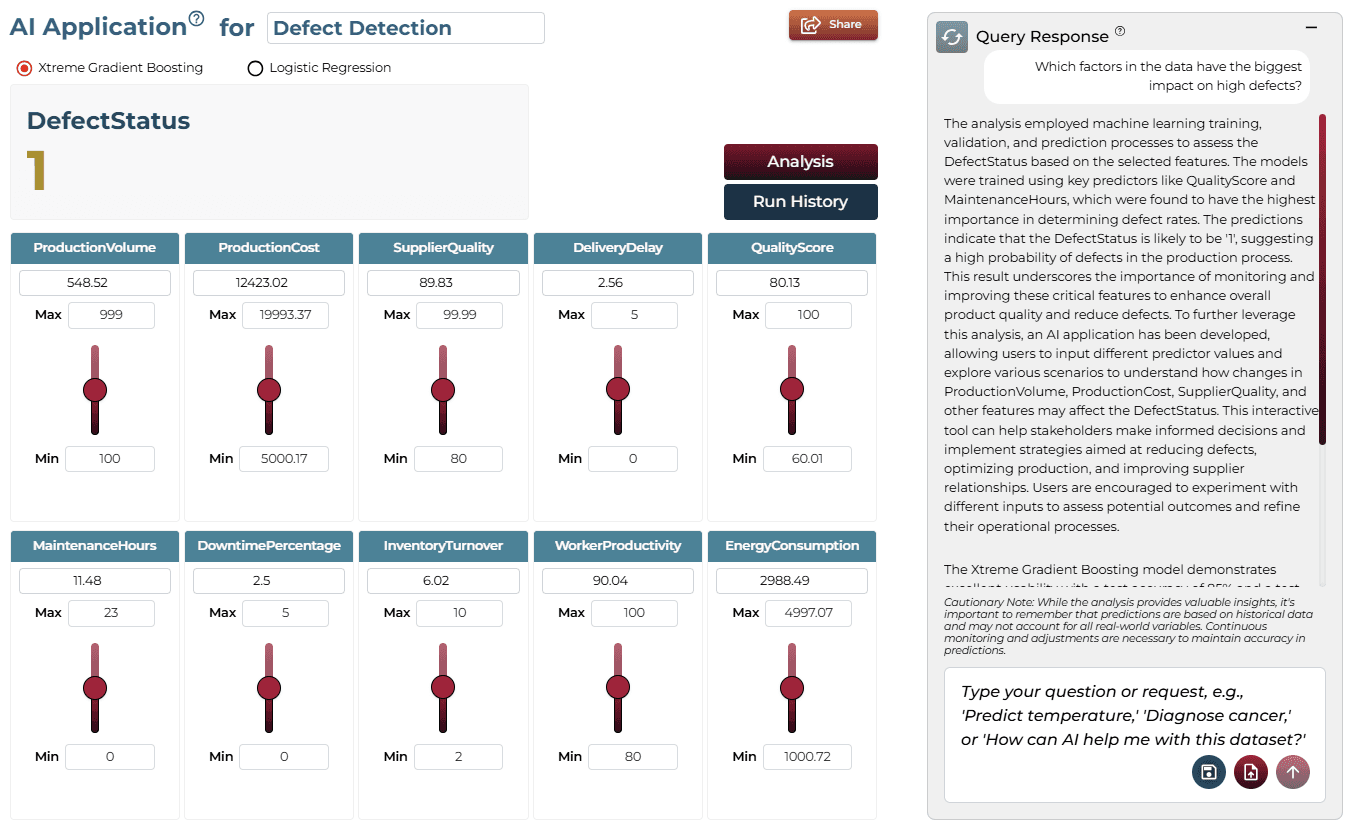
BAI Application
The interface includes sliders that allow users to adjust variables like maintenance hours and see how changes impact the predicted defect outcome in real-time.
Model Fine-Tuning/Manual Model Building
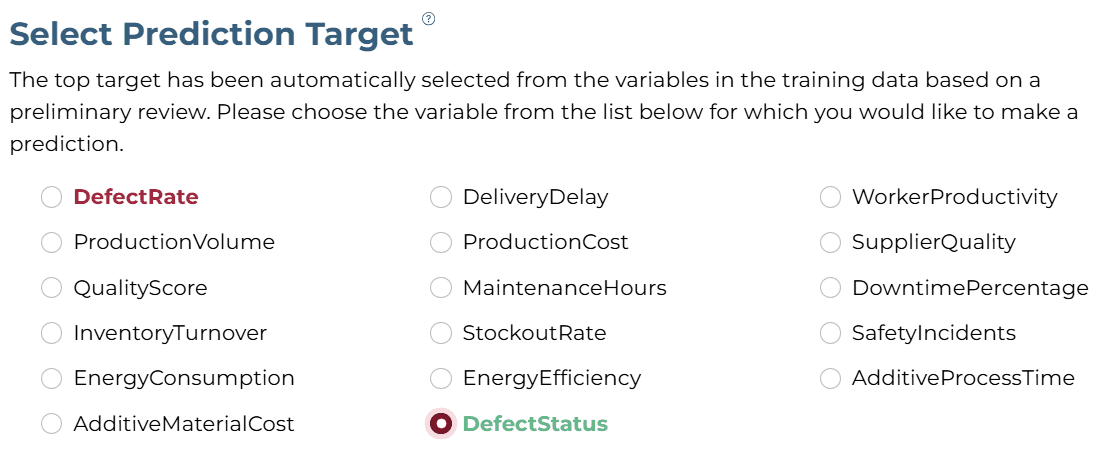
ASelecting Prediction Target
'DefectStatus' column was selected as the target.
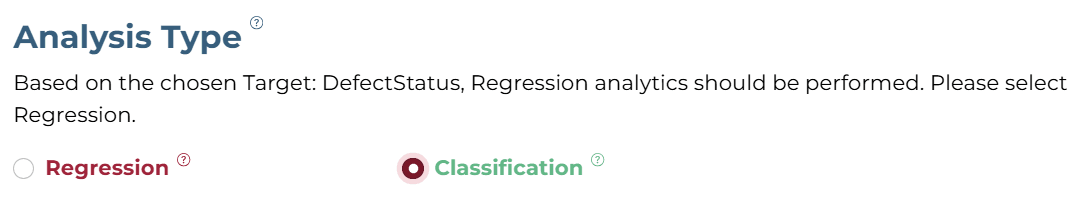
BSelecting Analysis Type
The analysis target is a categorical column. Hence, the 'Classification' analysis type is selected.
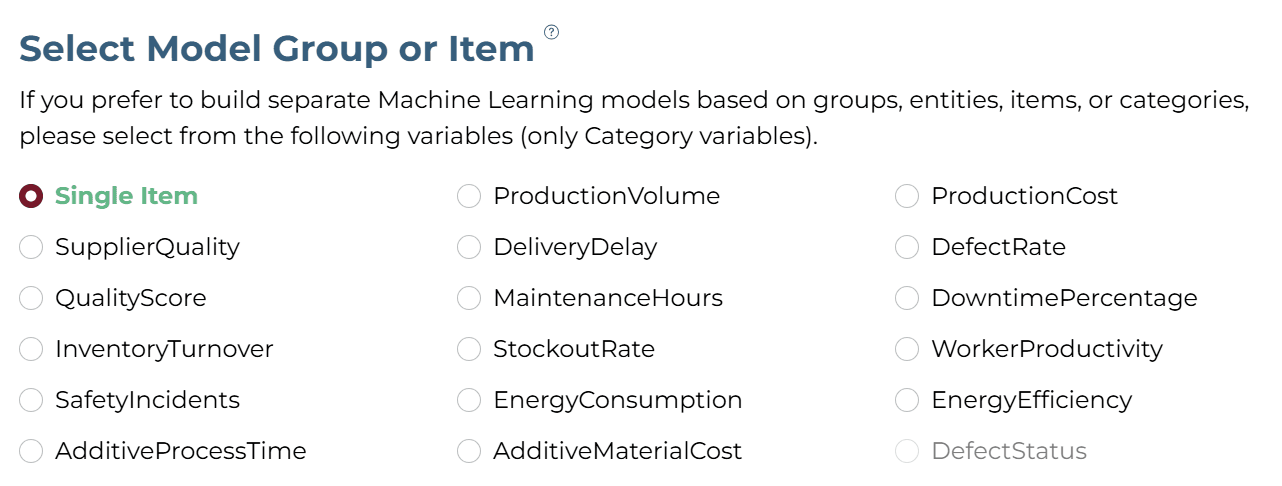
CSelecting Model Group/Item
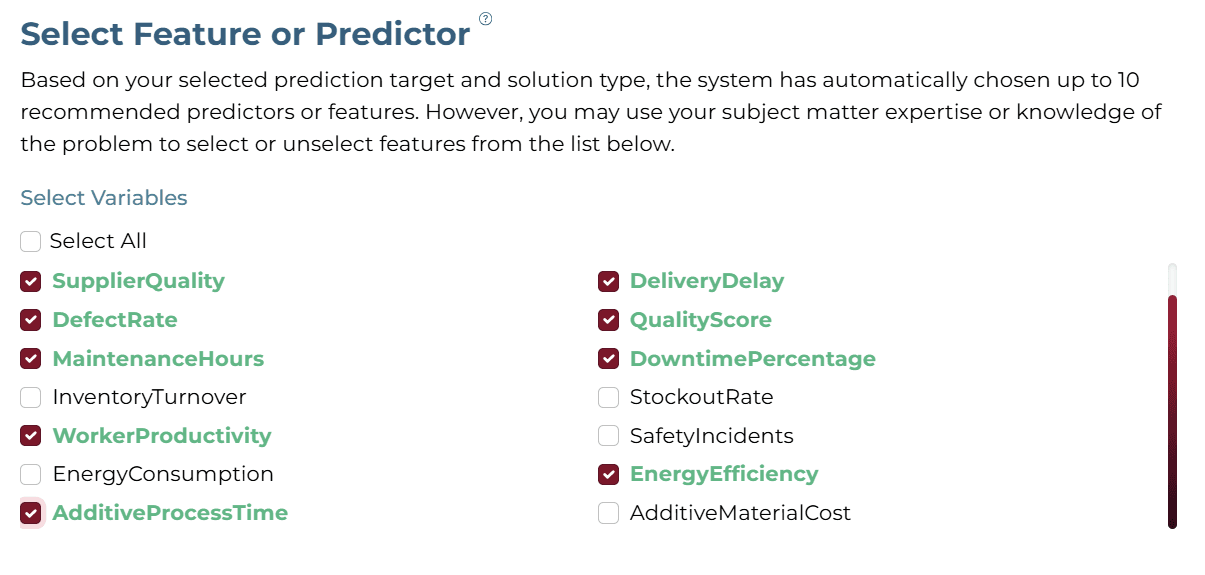
DSelecting Features
Select the most relevant features related to production and quality metrics.
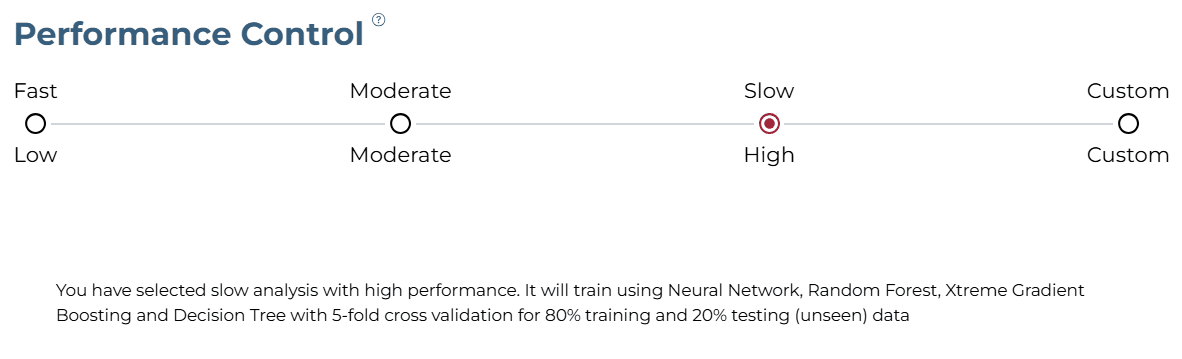
ESelecting Training Level
The "Slow" training level with "High Performance" configuration was selected for maximum accuracy.
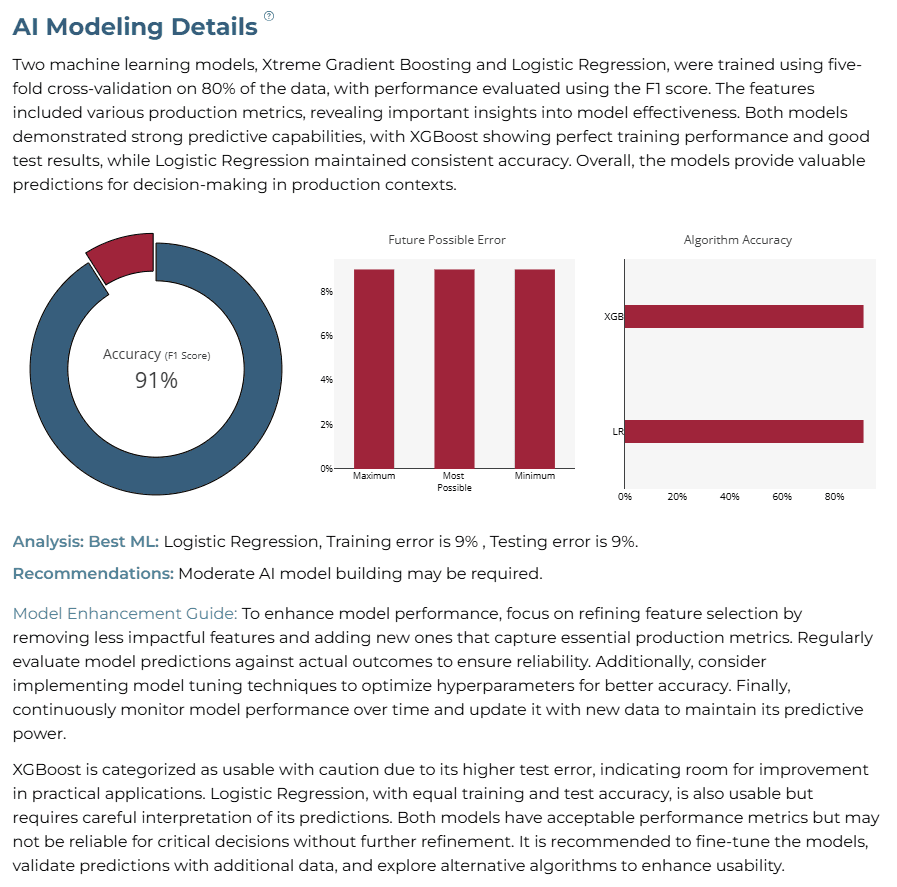
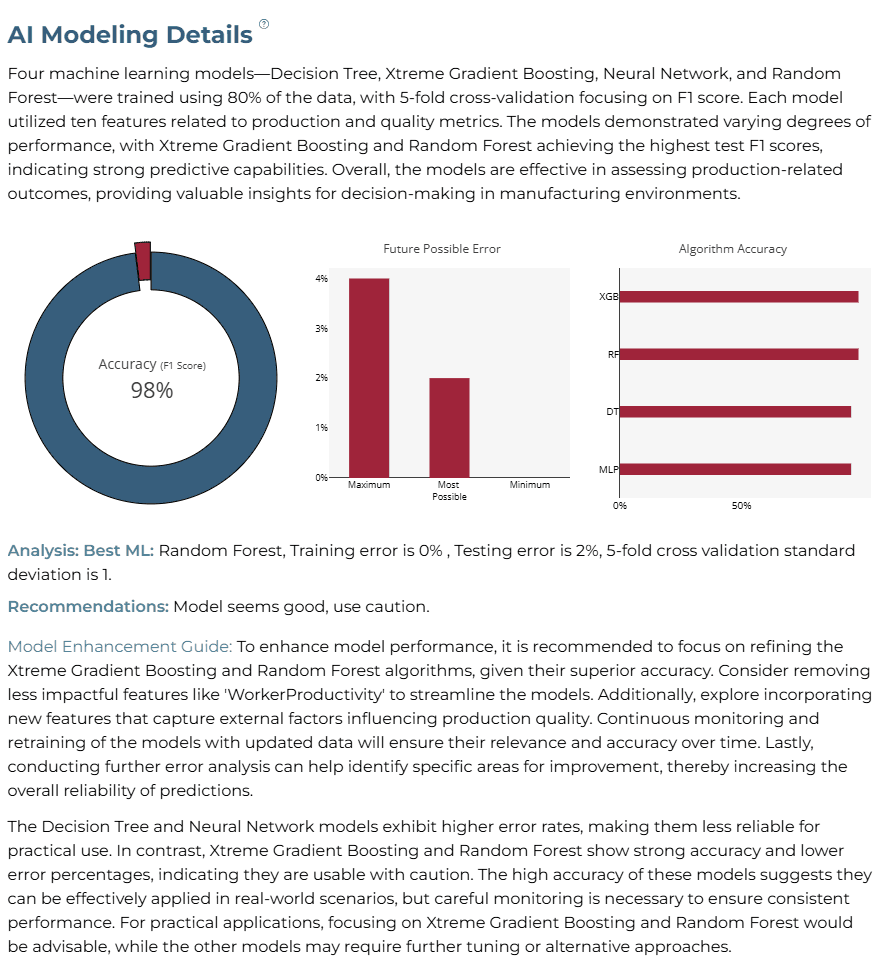
AI Modeling Details
Random Forest emerged as the best algorithm, providing the highest accuracy and lowest possible error percentages for defect status prediction.
Training Analysis Details
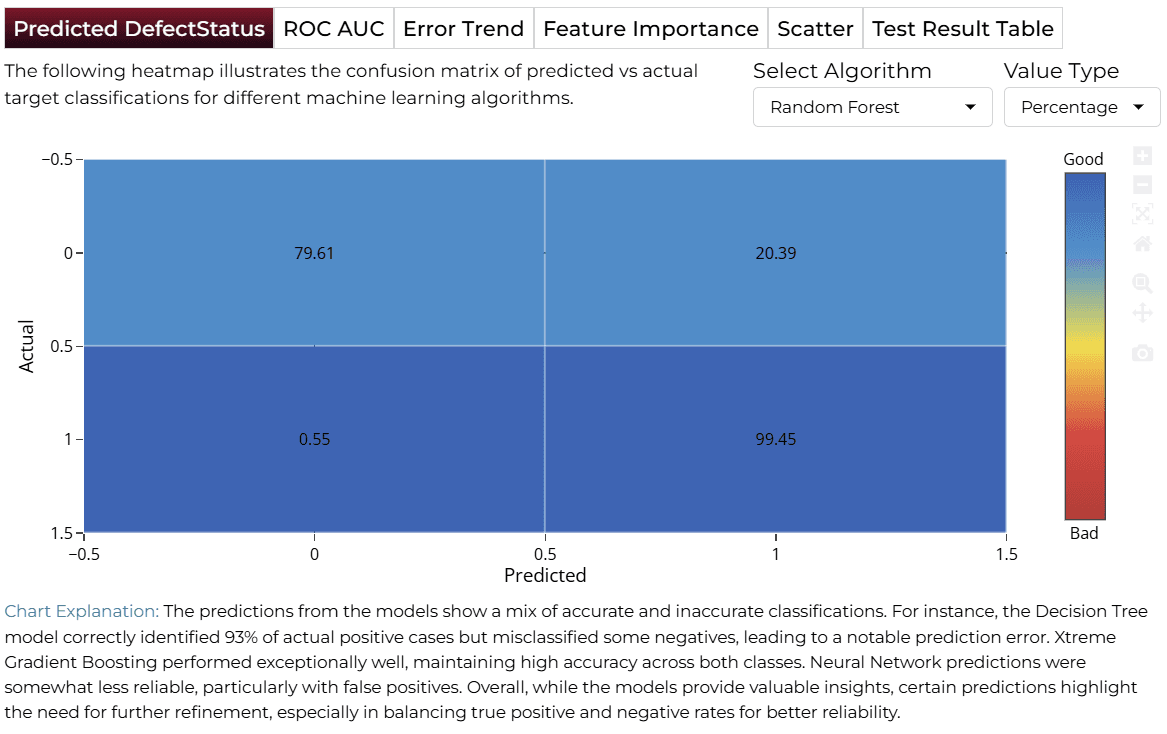
APredicted Target
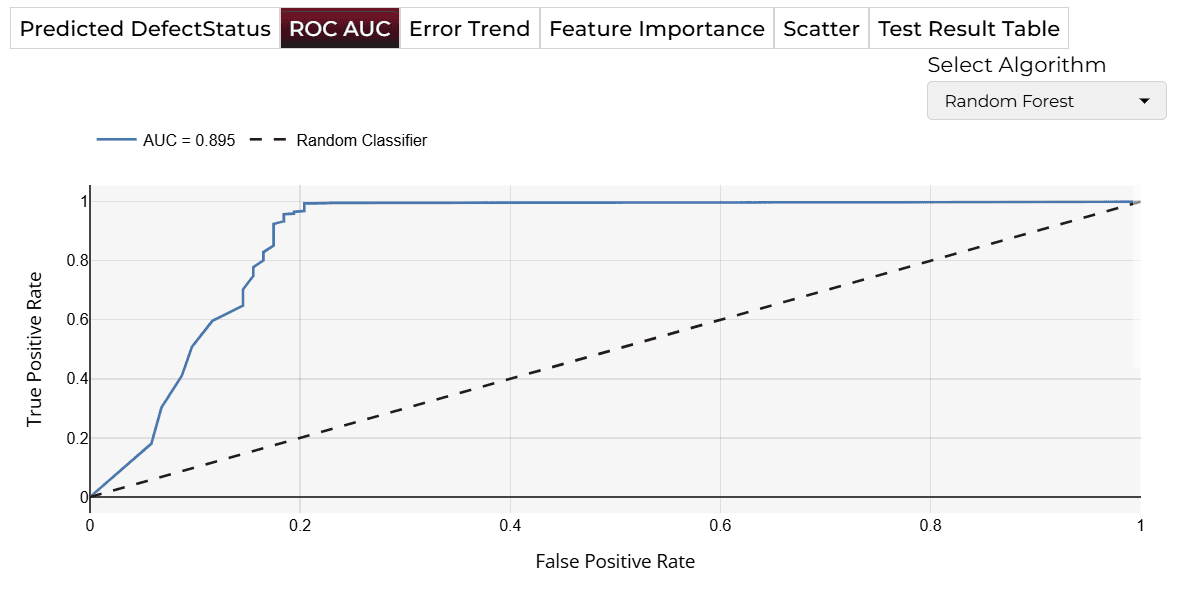
BROC AUC
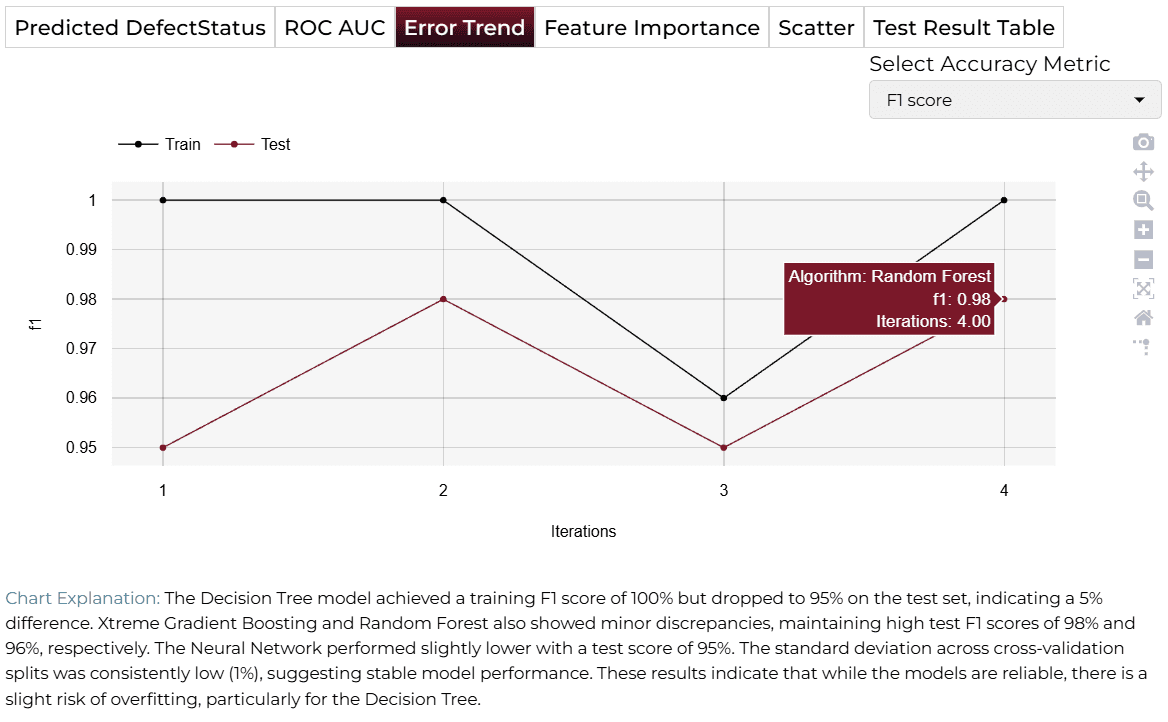
CError Trend
DFeature Importance
Finalize Models
Deploy the model once satisfied with the accuracy. Real-time predictions will help in immediate quality control on the shop floor.

4AI APPLICATION
Manual Model Building
In Manual Training Mode, users can modify sliders for variables like DefectRate, DowntimePercentage, and QualityScore to configure inputs and see real-time impact on defect probability.
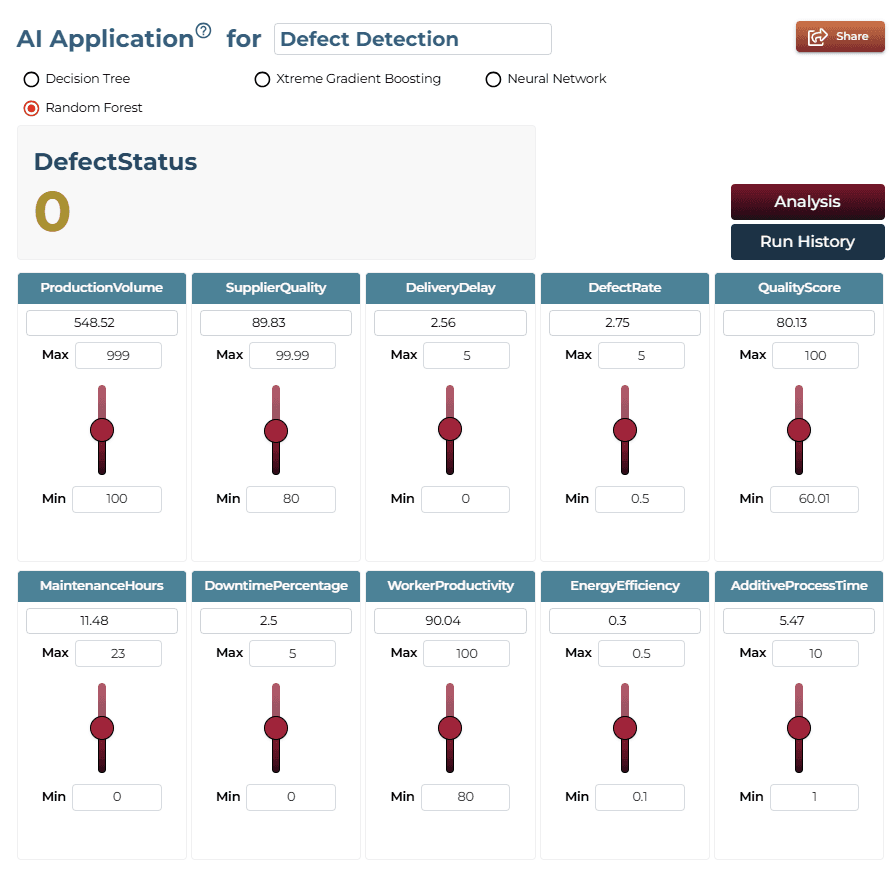
AI Application Demo
High values for DefectRate, DowntimePercentage, and MaintenanceHours generally correlate with higher defect status predictions, emphasizing the need for optimized maintenance.
Saving the Project
Save your project by clicking the icon at the bottom left corner of the textbox.

Sharing the Project
Share the application for single on-demand predictions once the analysis is saved.

Interested in similar AI solutions?
Explore our full suite of AI capabilities designed to transform your business operations.