

Predicting Oil Volume for Multiphase Flow Offshore Wells
Accurately forecasting oil volumes in complex offshore wells using advanced predictive models.
1Overview & Strategic Importance

Problem Statement
Oil production is volatile due to mix of Water and Gas during extraction. Expensive Well Test ($200k) or Multiphase fluid measuring meter ($250k to $400k) is required for continuous Oil production measurement. Requires many multiphase flows meter that costs ranges from $250k to $1m for each, can lead to $20m to $25m Capital expenditure only for sensor just for 1 platform.
Required Solutions
- Predict oil volume in real time based on available real time data.
- Search for optimum operation condition for maximum oil production.
Solution Objectives
- Perform exploratory data analysis.
- Build ML prediction model for daily oil production.
- Perform scenario analysis.
- Search for optimal operation condition for maximum production.
Understanding the Problem
Multiphase flow refers to the simultaneous movement of multiple fluid phases, such as oil, gas, and water, within porous materials. In oil wells, this phenomenon is common as reservoirs often yield both oil and gas, along with water production. The intricate and dynamic nature of multiphase flow systems presents significant challenges when predicting the quantity of oil within these environments.
One of the primary difficulties lies in phase mixing and separation. In multiphase flow, oil, gas, and water often mix, making it challenging to accurately measure and predict the volume of each phase. Effective separation of these phases is essential to ensure accurate predictions. Additionally, flow regime transitions, such as slug flow, annular flow, or stratified flow, occur rapidly within these systems. These transitions impact phase distribution and must be accounted for to achieve reliable predictions.
The properties and composition of the fluid phases also add complexity to multiphase flow systems. Variations in the density, viscosity, and other physical properties of oil, gas, and water under changing conditions influence their behavior. Real-time data on fluid composition and properties are crucial for accurate predictions. Furthermore, operational conditions, including changes in temperature and pressure, significantly affect phase behavior. Key parameters like tubing pressure, downhole temperature, wellhead pressure, and choke openings must be carefully monitored to predict oil volumes accurately.
Another major challenge is measuring flow rates and volumes within these systems. The separation of phases is not always straightforward, and traditional flow meters often fail to provide precise readings. The geometry and configuration of the system, including pipelines, valves, and separators, further complicate phase distribution and flow rates. Turbulence and mixing within the flow can exacerbate these challenges by causing additional dispersion of the phases.
Measurement errors and model uncertainties also contribute to the complexity. Errors in sensors, measurement devices, or data collection systems can lead to inaccuracies. Predictive models often rely on empirical correlations and simplified assumptions, which may not capture the full complexity of multiphase flow systems. Additionally, obtaining real-time data, especially in offshore or remote locations, remains a significant challenge.
2About the Data
Data Collection
The data is collected from a real-life well in Volve field (one of the latest databases released by Equinor (2020) to the public for research purposes) used to build the models. The database encompasses various data types, including seismic data, well log data, reservoir simulation models, and more. This study exclusively utilizes real-field production data from the database. The full dataset consists of the data of 7 wells. The well NO159–F–14H is used in this example problem.
Major Parameters Description
Download Training DataDATEPRDDate of Record
ON_STREAM_HRSOn stream hours
AVG_DOWNHOLE_PRESSUREAverage Downhole Pressure
AVG_DOWNHOLE_TEMPERATUREAverage Downhole Temperature
AVG_DP_TUBINGAverage Differential Pressure of Tubing
AVG_ANNULUS_PRESSAverage Annular Pressure
AVG_CHOKE_SIZE_PAverage Choke Size Percentage
AVG_WHP_PAverage Wellhead Pressure
AVG_WHT_PAverage Wellhead Temperature
3Using iDareAI
Guided Mode Initialization
AUploading Dataset
Click on the **'Upload CSV or Excel Data'** button → Select a source for the dataset → Upload `oil_production_train.csv`.

The system automatically analyzes the uploaded file, converting it into feature data. It then extracts the most likely descriptions of the columns and identifies the top three value-adding targets for prediction. Additionally, the system highlights the economic, social, and environmental impacts of predicting each target.
BChoosing Analysis Mode
Note: In autonomous model building mode, the training process begins by asking a question in the chat box related to the problem you want to solve, such as:
- How to know how much oil will be produced from the bore using this data?
- What are the main factors that affect oil production volume in this dataset?
- How do factors like pressure and temperature impact the bore oil production?
Operation Using Autonomous Guided Mode
For autonomous mode, a query was posed and the button clicked to send it for analysis. The system automatically performed the predictive analysis by itself, returned the query response, and finally built an automated AI application on-demand run by deploying the models.
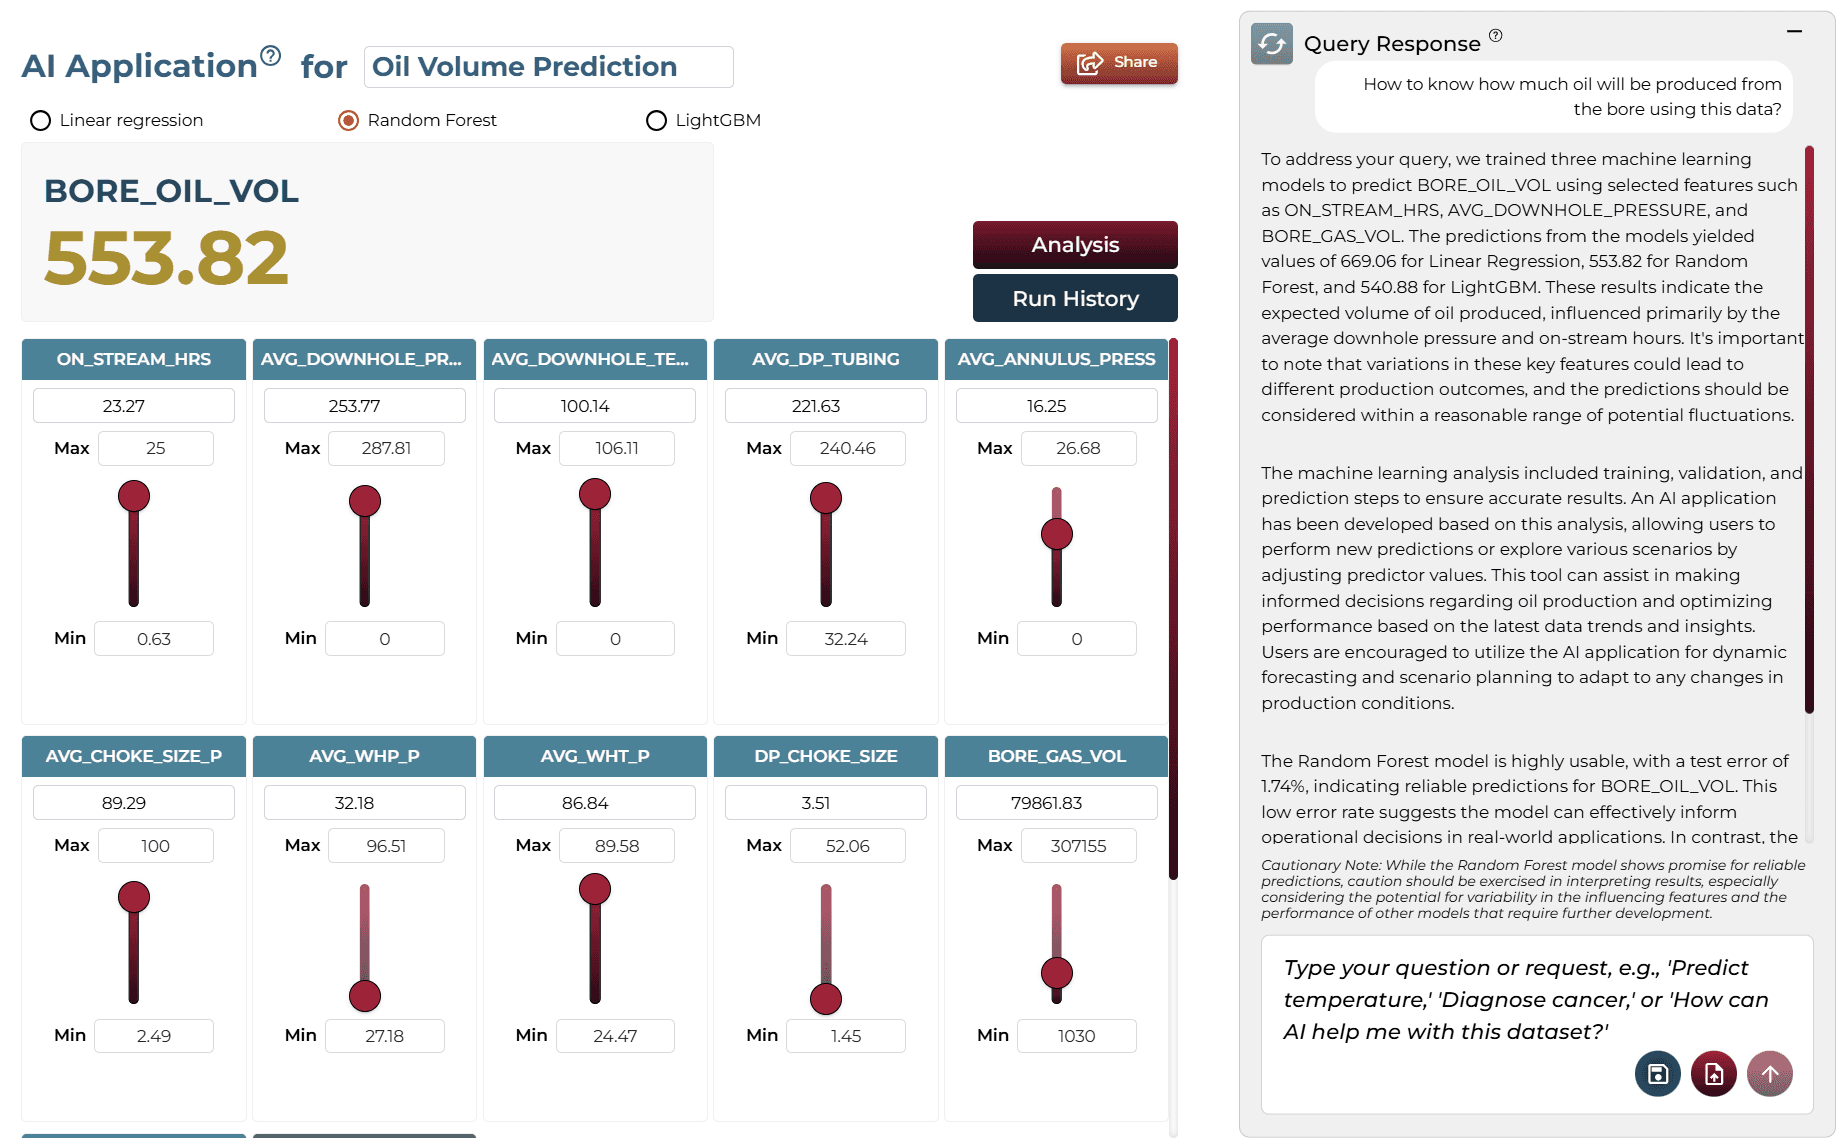
AQuery: “How to know how much oil will be produced from the bore using this data?”
BQuery Response
To determine how much oil will be produced from the bore using the provided data, you can utilize the trained machine learning models. The Random Forest model, which performed best in terms of accuracy, predicts a volume of approximately 575.05 units of oil. This prediction is influenced by key features such as ON_STREAM_HRS and AVG_DOWNHOLE_PRESSURE, which significantly affect production levels. Variations in these features can lead to fluctuations in the predicted oil volume, so it's essential to consider a range around this estimate for practical applications.
The analysis involved machine learning training, validation, and prediction steps to derive these insights. The AI application built on this analysis allows users to input new values for the selected features and generate updated predictions. This flexibility enables users to explore different scenarios and understand how changes in operational parameters might impact oil production.
CAI Application
In automated mode, running the query solves the problem for you step by step and generates the AI application. Users can choose between multiple models for generating predictions. The interface includes sliders that allow users to adjust key variables and see how changes impact the predicted outcome.
Model Fine-Tuning/Manual Model Building
Manual model building allows users to take full control of the model creation process by guiding them step-by-step through data preparation, feature selection, algorithm configuration, model training, and validation.
ASelecting Prediction Target
Analyzing the problem statement and query response, the 'BORE_OIL_VOL' is selected as the target for this solution.

BSelecting Analysis Type
Oil volume is a numeric value and to predict a numeric value, the 'Regression' analysis type should be selected.

CSelecting Model Group/Item
No item/group is required for this dataset.

DSelecting Features
From the list of features, uncheck ‘BORE_GAS_VOL’ and ‘BORE_WATER_VOL’, as we only aim to predict the volume of oil produced.

Select the following features: ON_STREAM_HRS, AVG_DOWNHOLE_PRESSURE, AVG_DOWNHOLE_TEMPERATURE, AVG_DP_TUBING, DP_CHOKE_SIZE.
ESelecting Training Level
The "Moderate" training level and performance configuration was selected for this example.

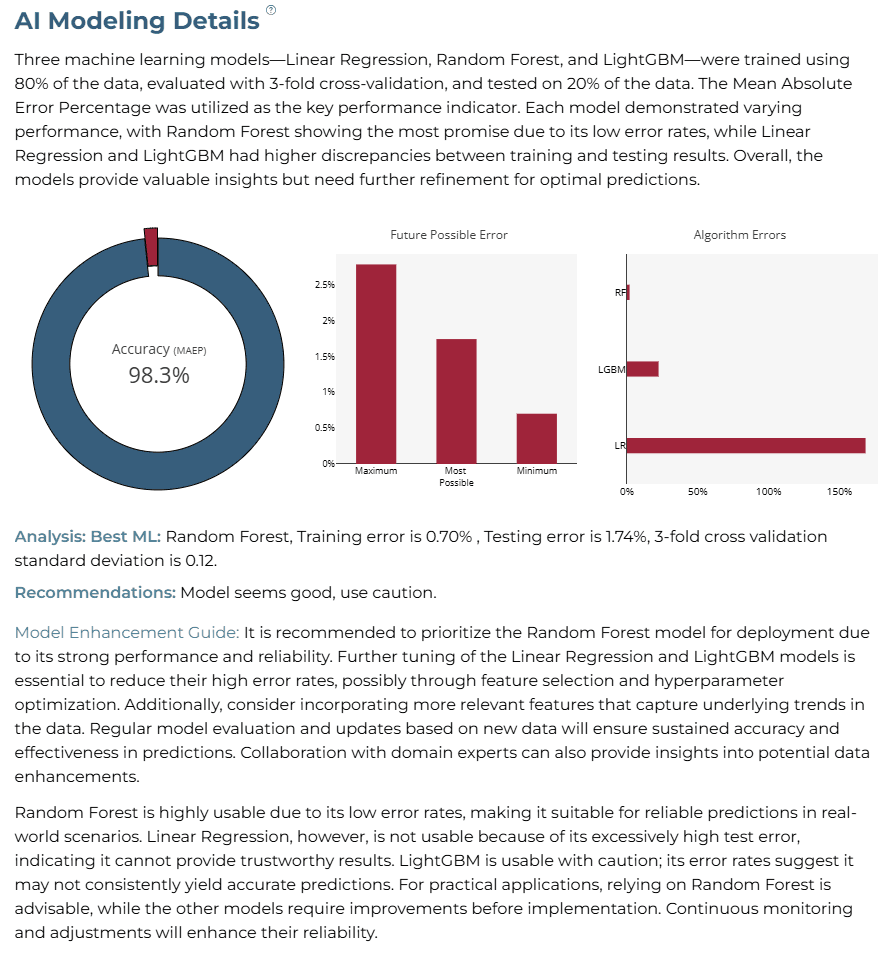
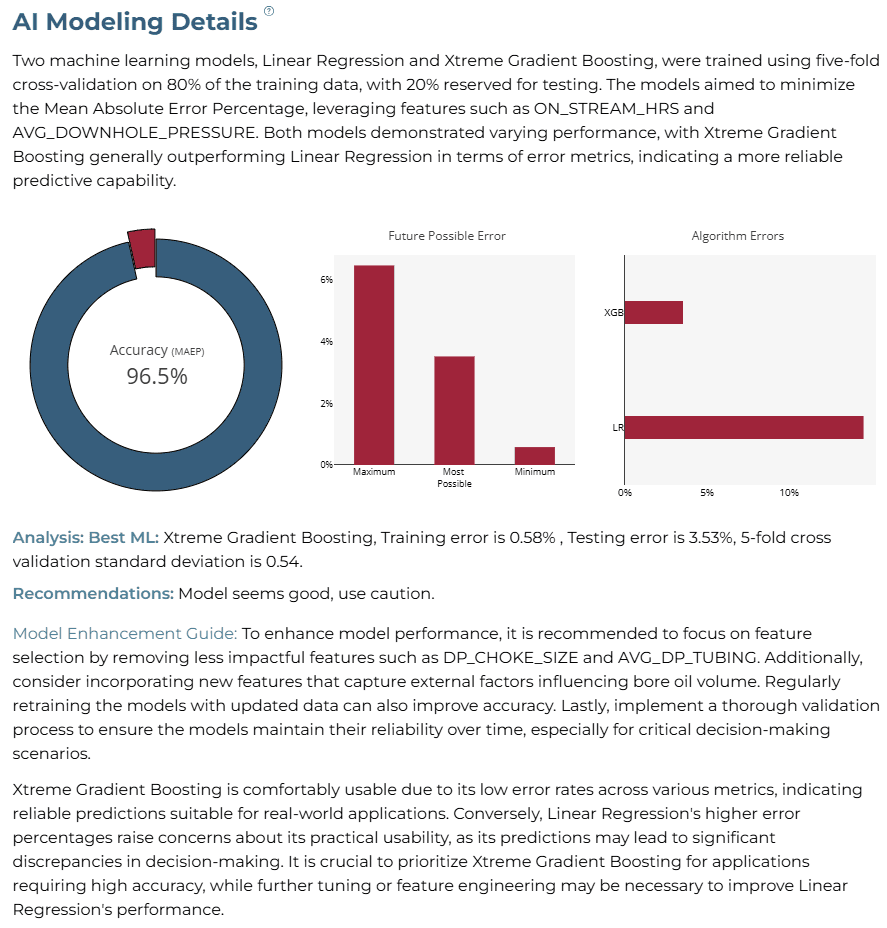
AI Modeling Details
Two machine learning models, Linear Regression and Xtreme Gradient Boosting, were trained and evaluated. Xtreme Gradient Boosting demonstrated superior performance, achieving a training error of 0.58% and a testing error of 3.53%. The overall accuracy achieved was 96.5%.
Training Analysis Details
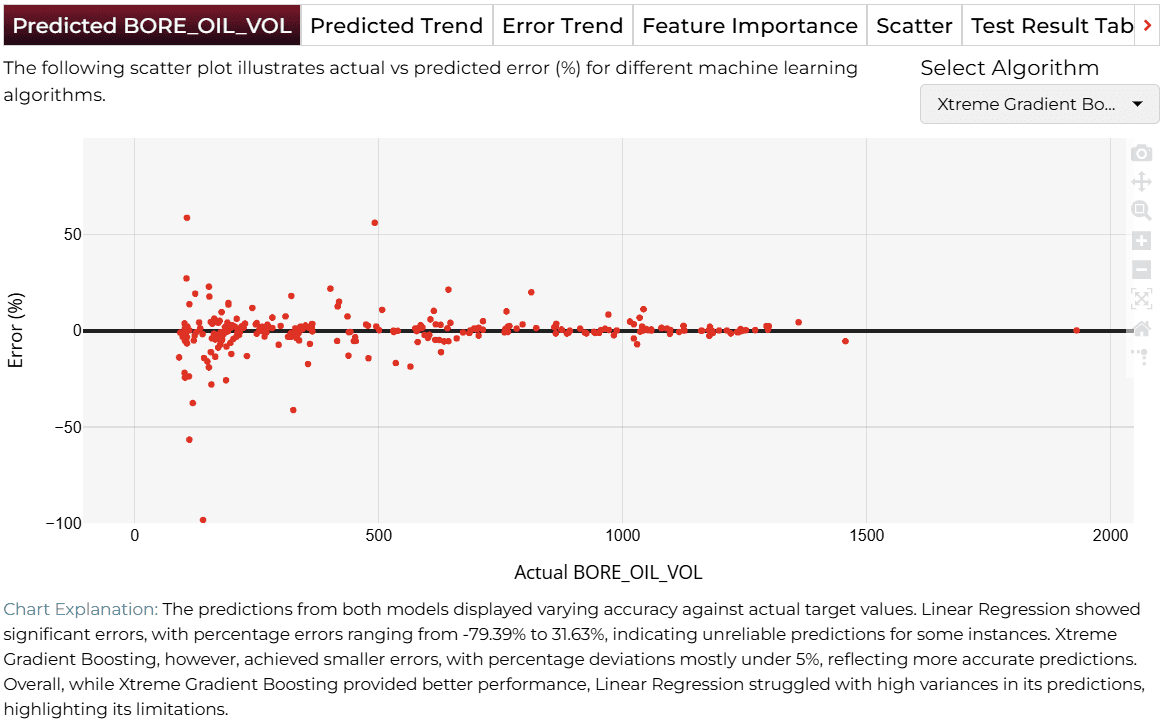
APredicted Target
Scatter plot comparing actual vs. predicted values. Xtreme Gradient Boosting demonstrated significantly lower errors.
BPredicted Trend
Time-series comparison. Xtreme Gradient Boosting closely mirrored the actual trends.

CError Trend
MAEP over multiple iterations. Xtreme Gradient Boosting outperformed other models with a test error of 3.53%.

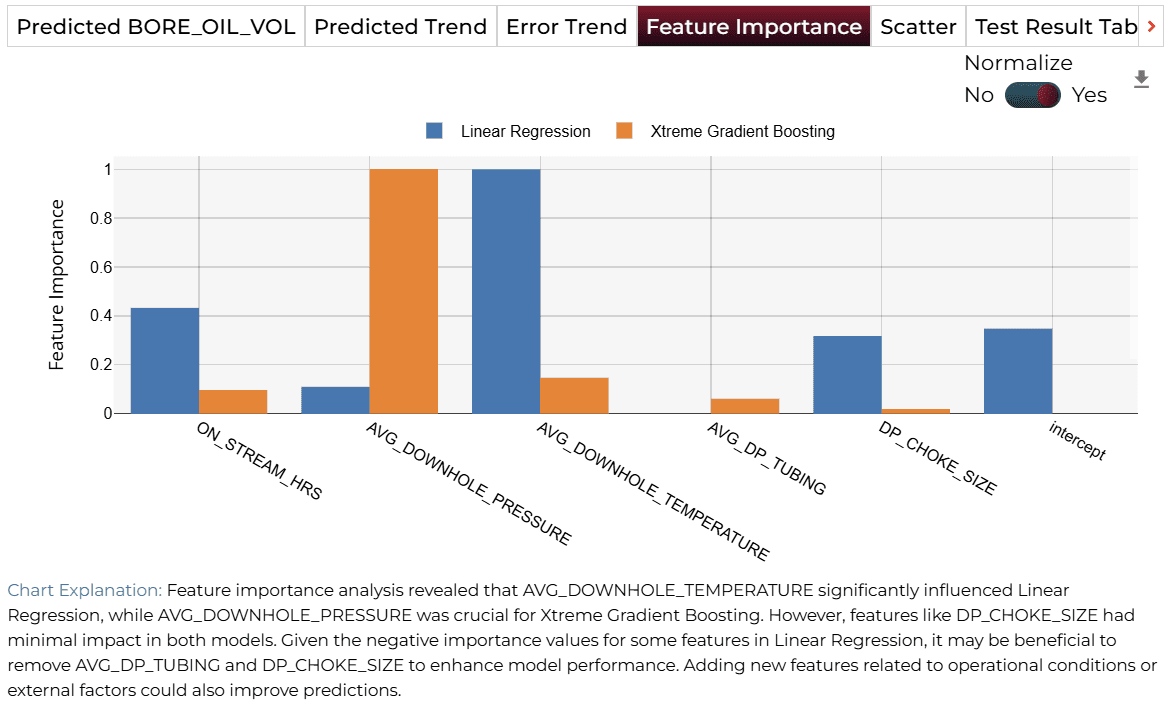
DFeature Importance
'AVG_DOWNHOLE_PRESSURE' was highly influential in Xtreme Gradient Boosting.
Finalize Models
Once you are satisifed with the performance of your selected ML model(s), click on the 'Deploy' button. In this case, the system will save the selected and trained model(s) and deploy them for future demand analysis or batch predictions for production environment.

4AI APPLICATION
Manual Model Building
In the Manual Training Mode, the query response dynamically adjusts to the values selected for the features in the AI Application interface. Users can manually modify sliders to explore different scenarios by adjusting predictor values.
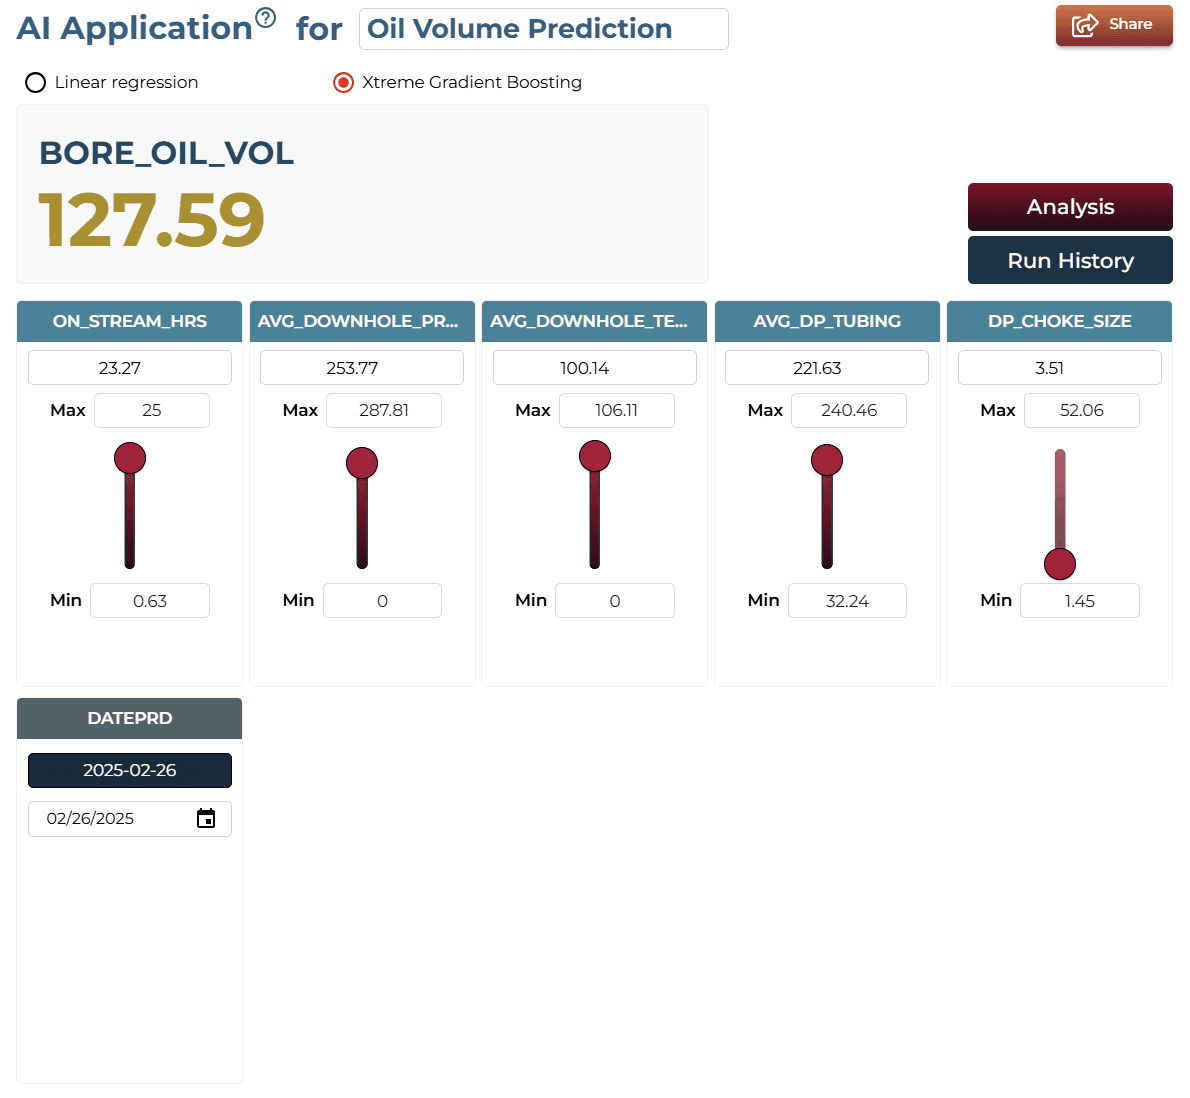
AI Application Demo
- The initial states of the features show the predicted 'BORE_OIL_VOL' as a baseline value.
- Using the slider, increase the ‘AVG_DOWNHOLE_PRESSURE’ feature.
- The predicted 'BORE_OIL_VOL' will now change, reflecting the increased impact of downhole pressure.
Saving the Project
The interface allows you to save the AI analysis. For this purpose, you have to save your project by clicking on the icon at the bottom left corner of the textbox.

Sharing the Project
The system also allows sharing the application for single on-demand predictions accessible to anyone once the analysis is saved.

Interested in similar AI solutions?
Explore our full suite of AI capabilities designed to transform your business operations.