

Predicting Stock Market Closing Prices
Enhancing financial decision-making by predicting stock market closing prices based on historical trends.
1Overview & Strategic Importance

Problem Statement
Predicting stock market closing prices is a valuable exercise in understanding financial trends, market behavior, and investment strategies. Stock prices fluctuate due to various factors, including supply and demand, economic conditions, investor sentiment, and external events. By analyzing historical stock data, traders and analysts can gain insights into price patterns and market dynamics.
Disclaimer
This solution is developed strictly for educational purposes and should not be used for real-world financial decision-making or investment advice. Stock markets are inherently unpredictable.
Required Solutions
- Analyzing historical stock trends using moving averages, volume, and fluctuations.
- Identifying influential factors that affect stock price movement for strategic analysis.
- Demonstrating predictive modeling techniques applied to complex financial data.
Solution Objectives
- Perform exploratory data analysis to understand stock market trends and key variables.
- Develop a regression-based model to estimate closing prices based on historical patterns.
- Evaluate market scenarios to observe how prices react to various economic conditions.
Understanding the Problem
Stock prices are influenced by numerous factors, including economic conditions, market trends, investor sentiment, and geopolitical events.
While predictive models can identify trends in historical data, they cannot guarantee future price movements. This project serves as an educational exploration of financial data analysis.
2About the Data
Data Collection
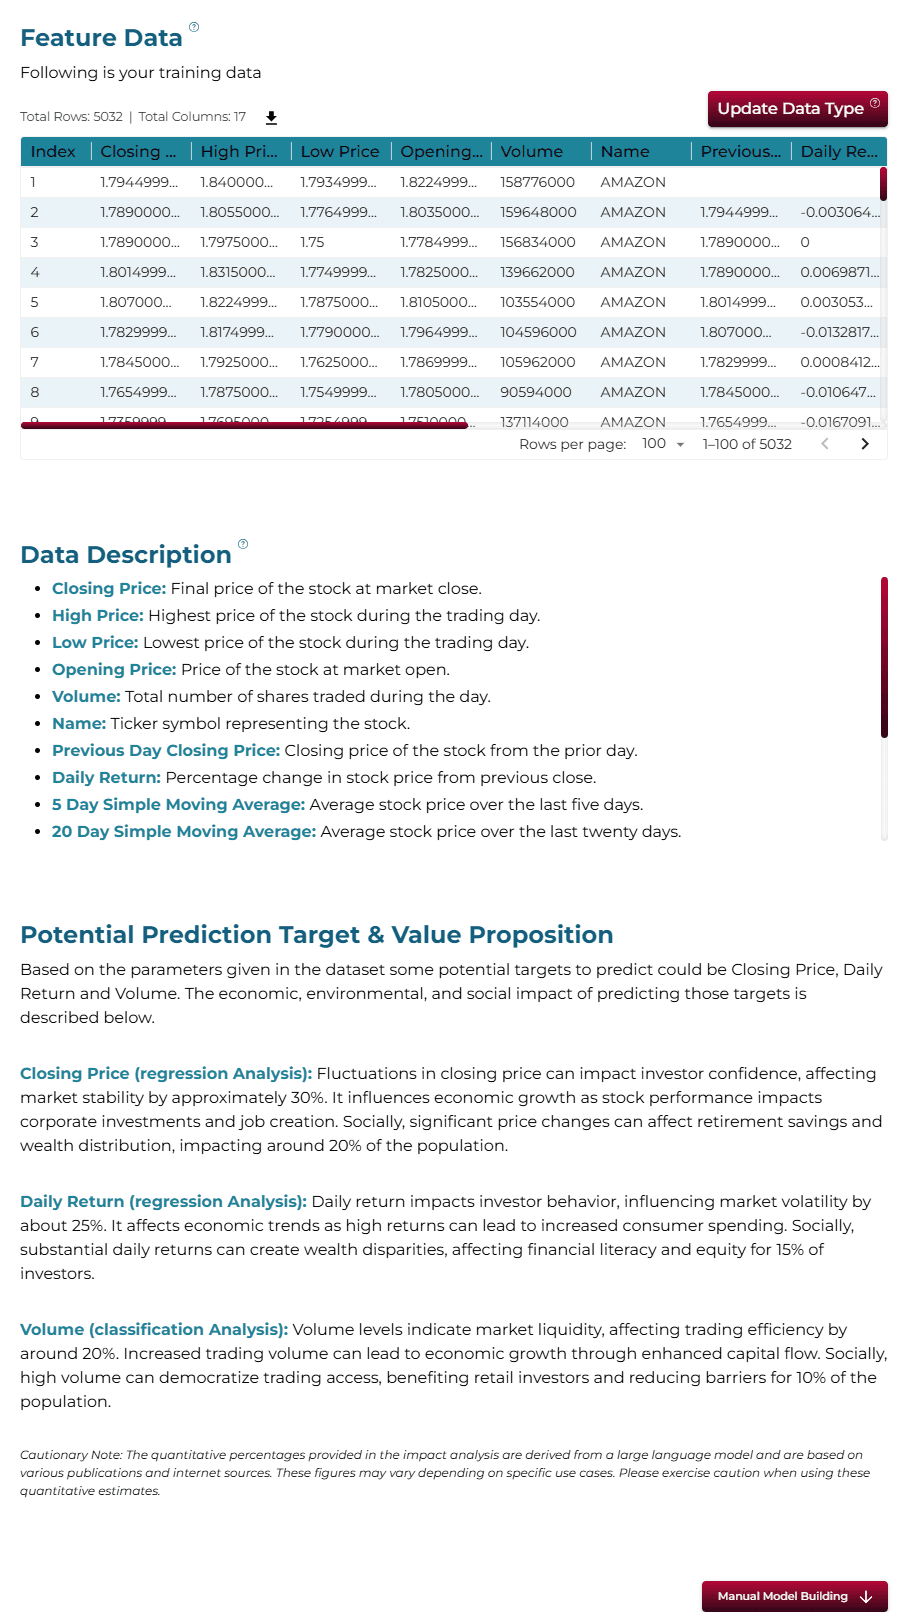
This dataset contains stock market data aimed at predicting stock closing prices based on various financial indicators. It is suitable for analyzing market trends and forecasting movements for educational purposes.
Major Financial Indicators
Download Training DataStock NameThe name or ticker symbol of the stock being analyzed, representing the specific company or asset.
Opening PriceThe stock price at the beginning of the trading session, serving as a reference point for intraday movements.
Closing PriceThe final stock price at the end of the trading session, used as the target variable for prediction.
High PriceThe highest price reached by the stock during the trading session, indicating intraday volatility.
Low PriceThe lowest price of the stock within the trading session, helping assess price fluctuations.
VolumeThe total number of shares traded during the session, reflecting market activity and liquidity.
Previous Day Closing PriceThe stock’s closing price from the previous trading day, used for calculating price changes and trends.
Daily ReturnThe percentage change in stock price compared to the previous day’s closing price, indicating short-term price movements.
Simple Moving Average (SMA)The average stock price over a specific period (e.g., 5-day, 20-day), used to identify market trends.
3Using iDareAI
Guided Mode Initialization
AUploading Dataset
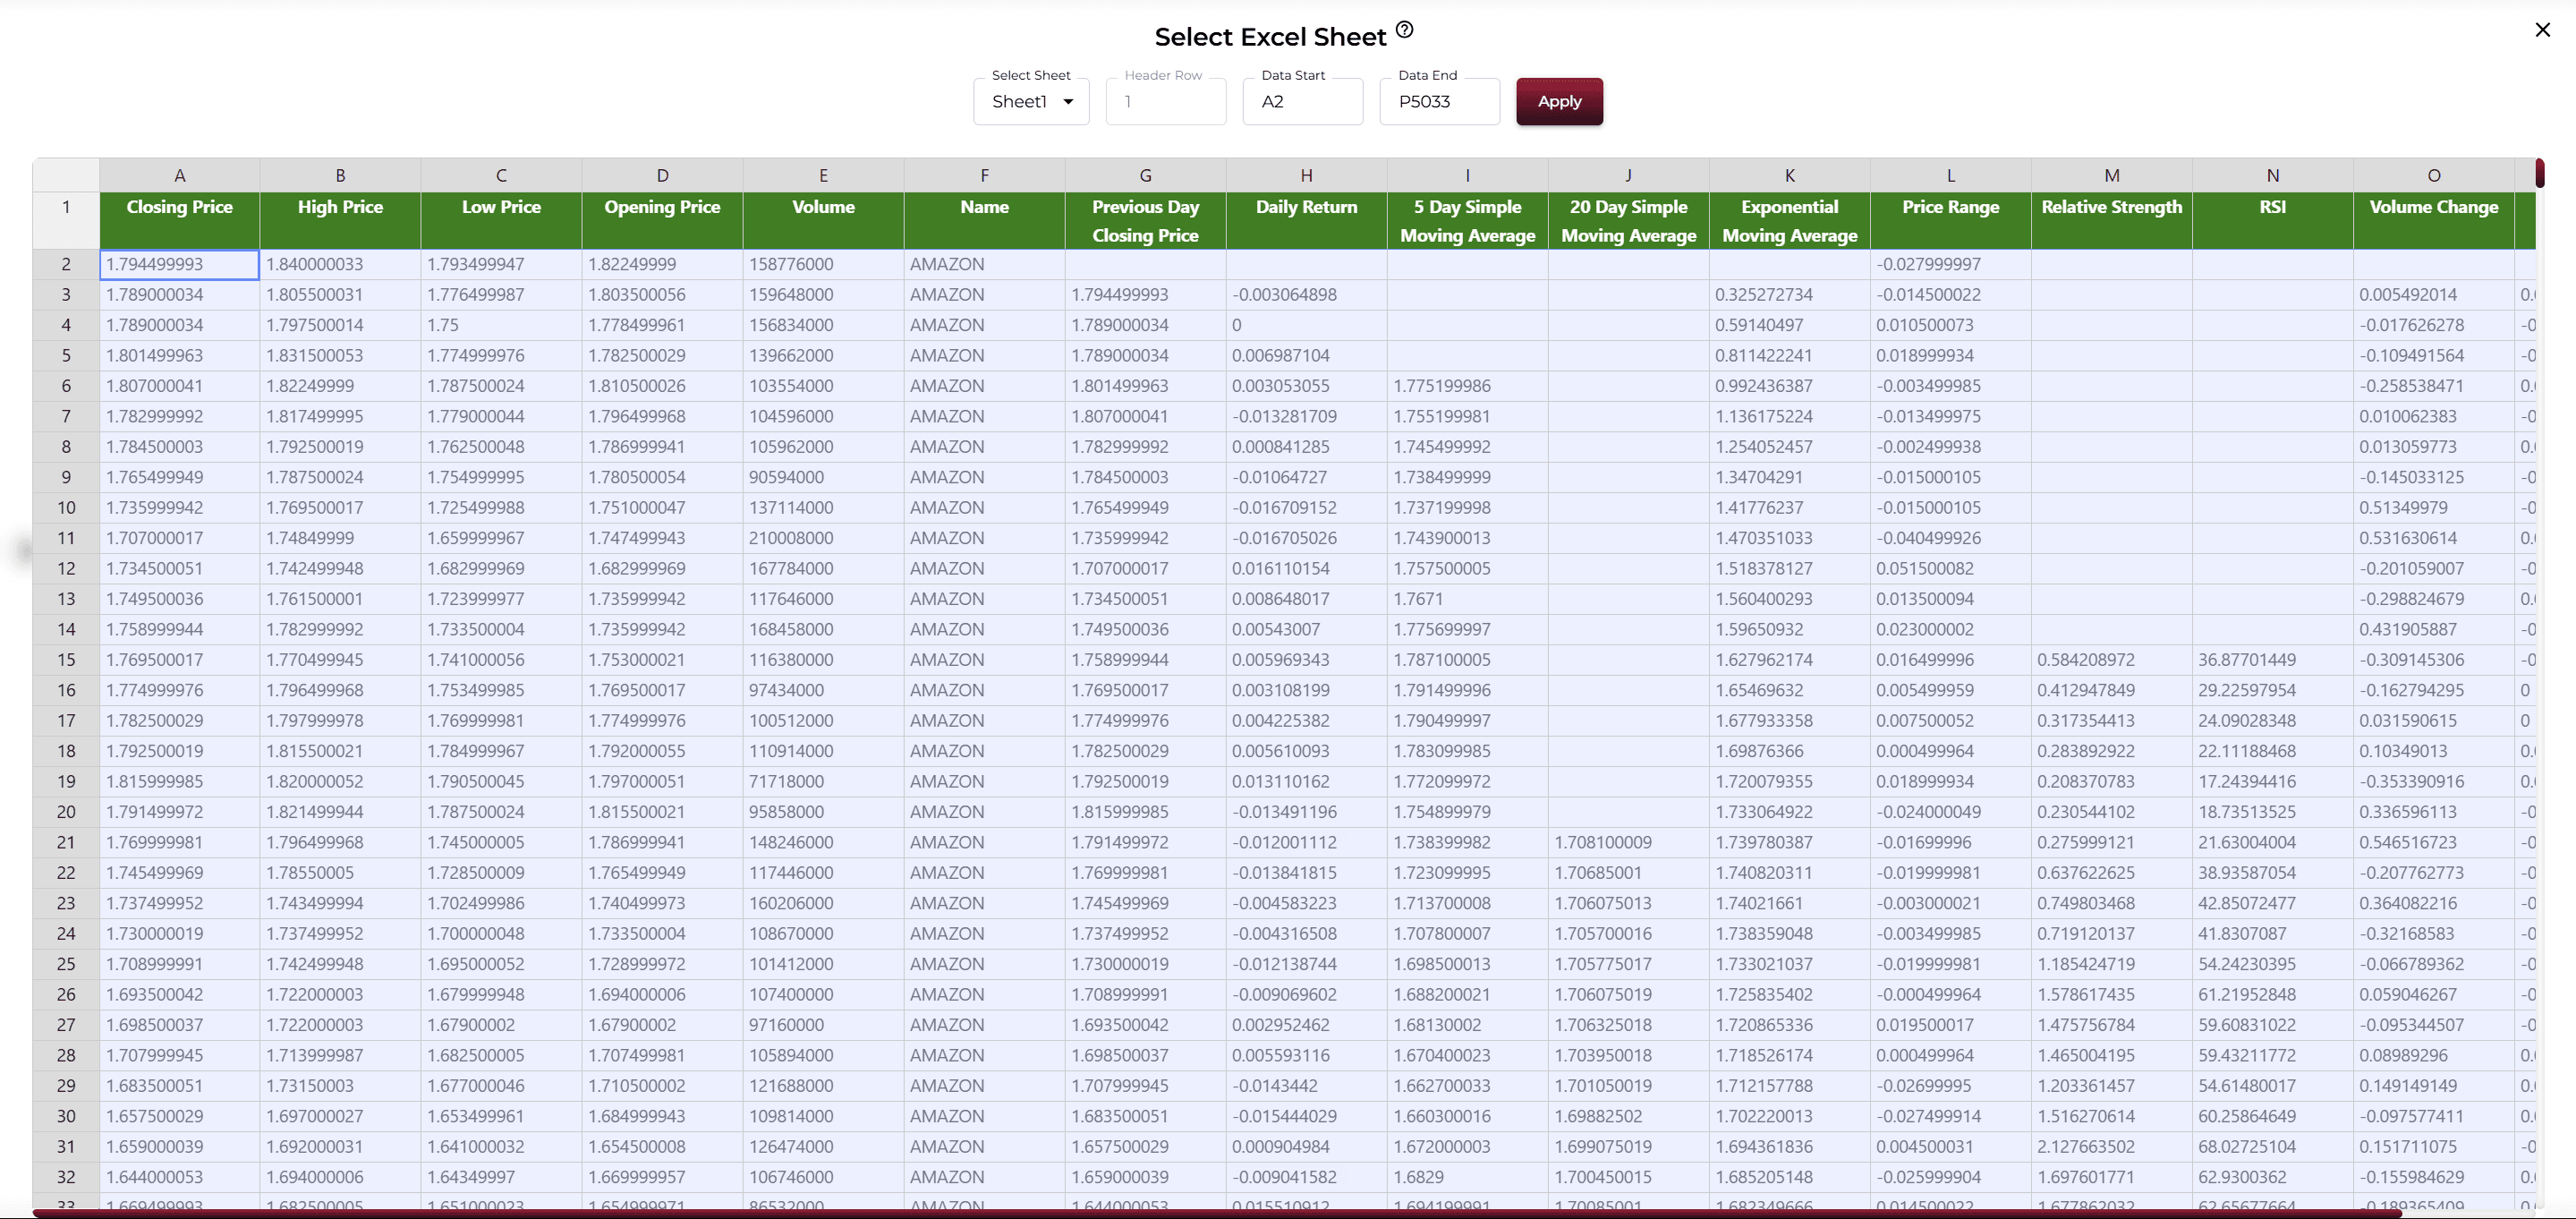
Click on the **'Upload CSV or Excel Data'** button → Select a source for the dataset → Upload `stock_prediction_train.xlsx`. The system automatically analyzes the file and identifies value-adding targets.
BChoosing Analysis Mode
- How can closing prices of the stock market be predicted from the provided information?
- How can closing prices be optimized using this dataset?
Operation Using Autonomous Guided Mode
AQuery Response
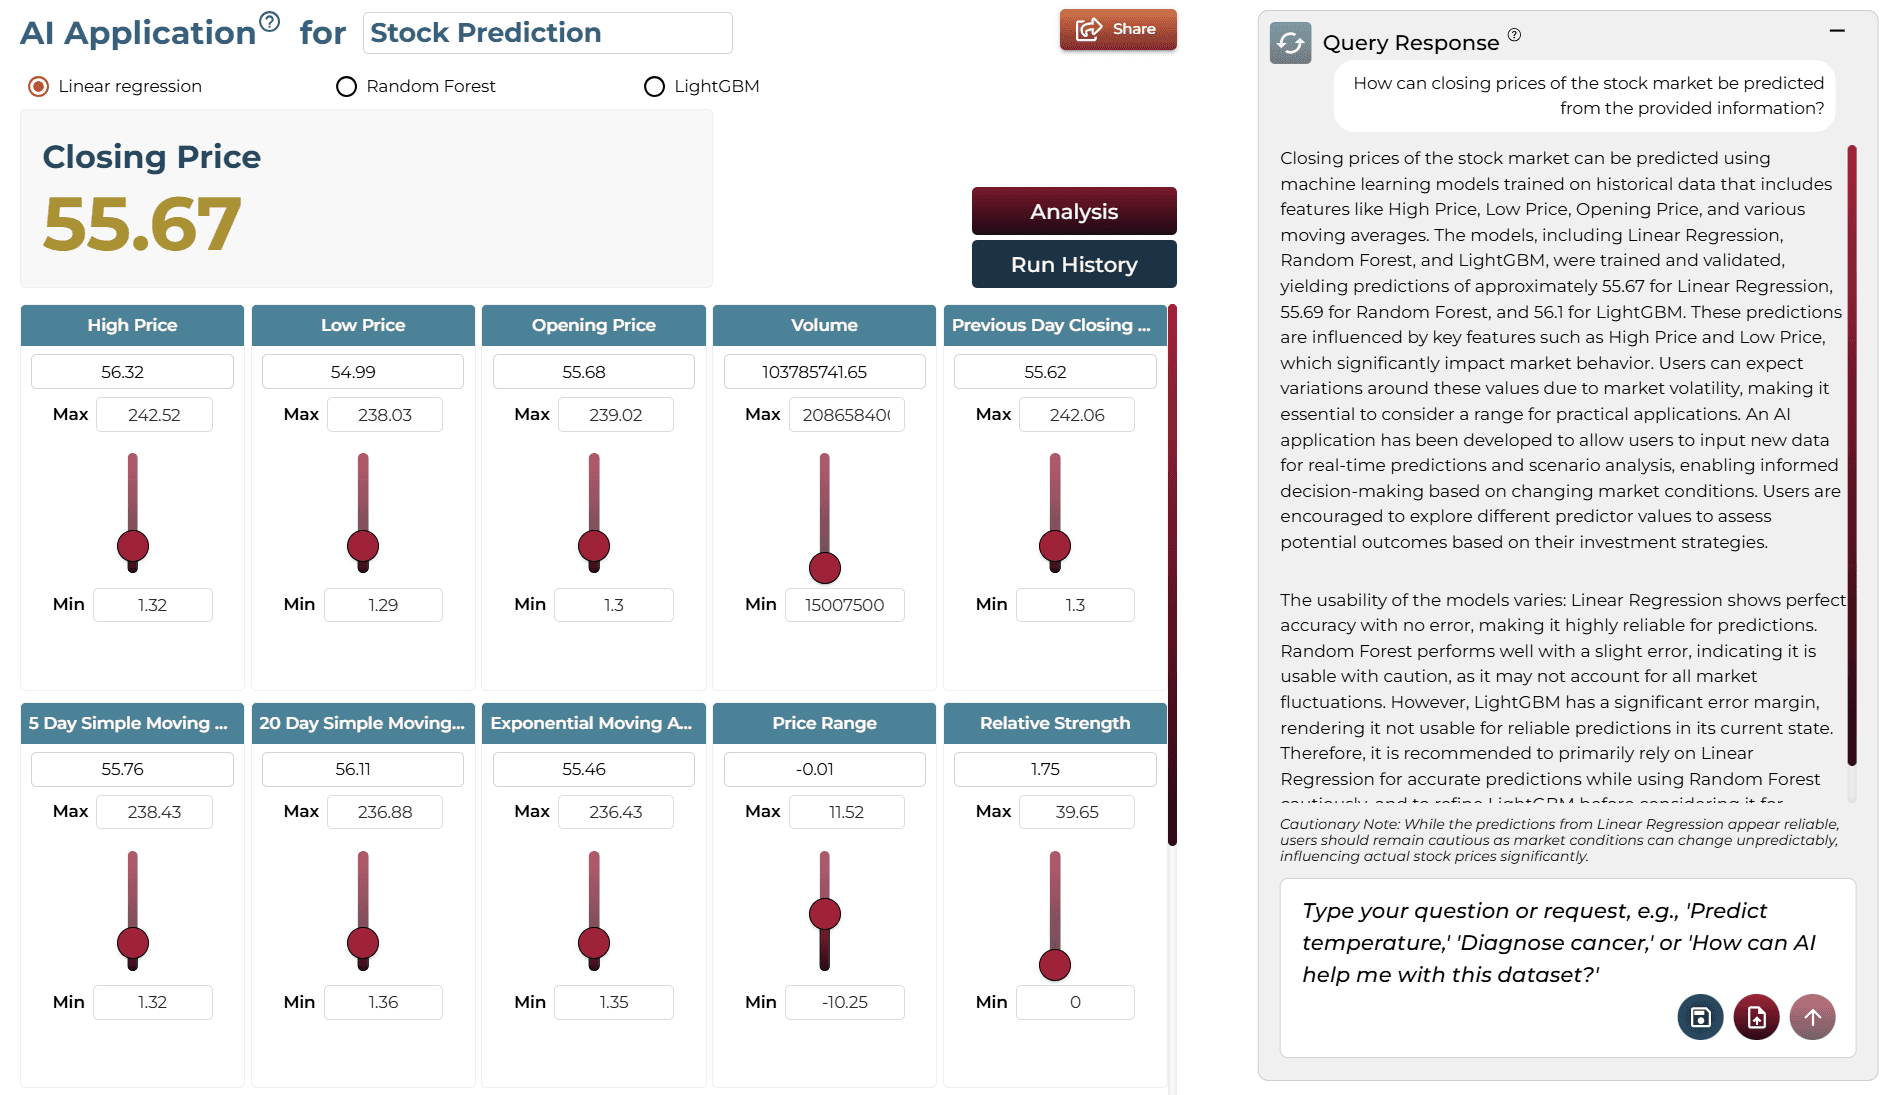
Predicted closing prices are approximately 55.67 (Linear Regression), 55.69 (Random Forest), and 56.1 (LightGBM). Linear Regression shows high reliability for historical data patterns.
BAI Application
Running the query generates an AI application where users can adjust sliders to test scenarios. Note: 100% accuracy in historical data may indicate overfitting in real-world scenarios.
Model Fine-Tuning/Manual Model Building
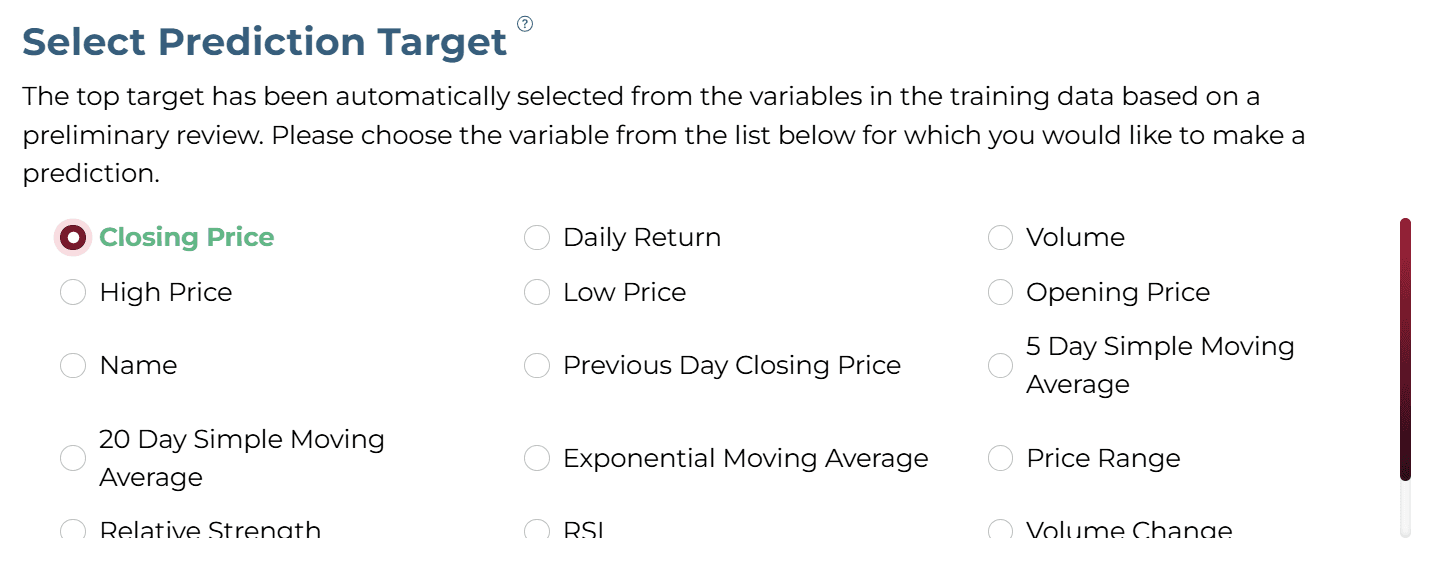
ASelecting Prediction Target
'Closing Price' was selected as the target column.
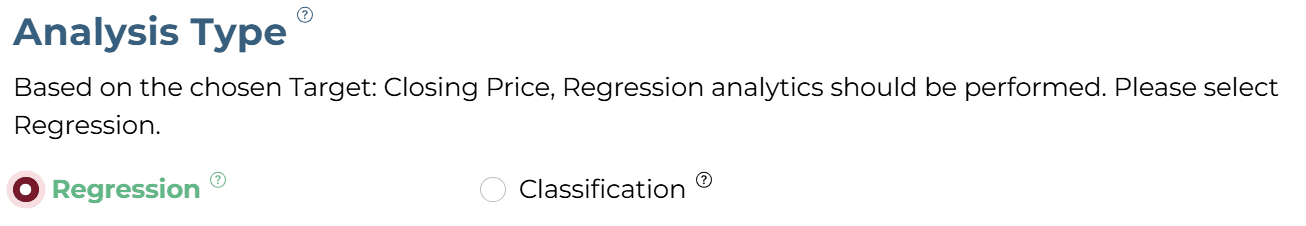
BSelecting Analysis Type
'Regression' analysis type is selected for numerical continuous price data.
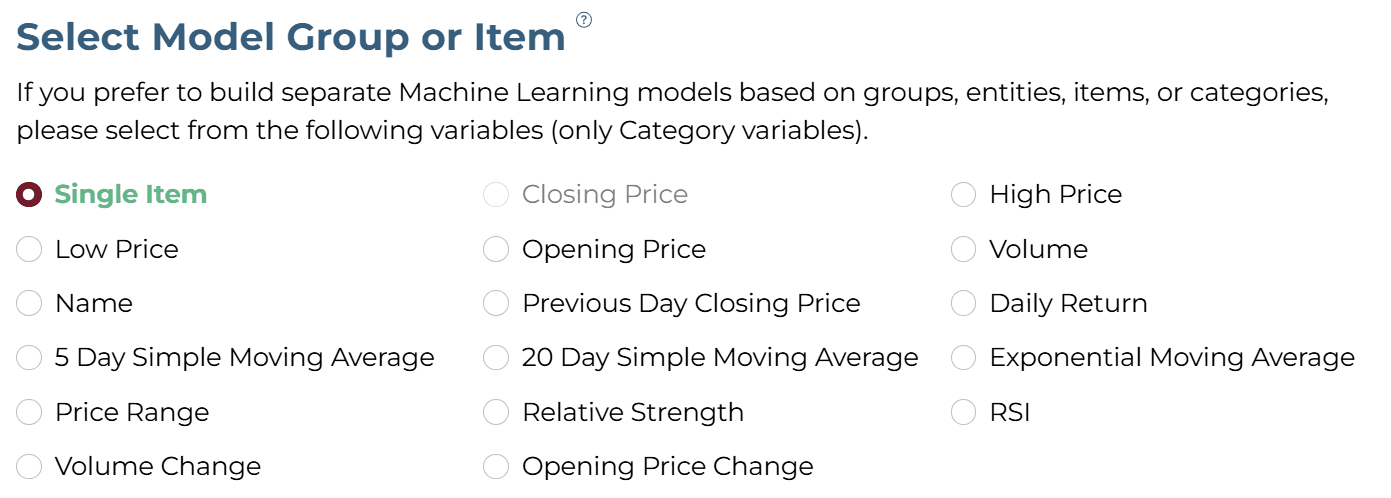
CSelecting Model Group/Item
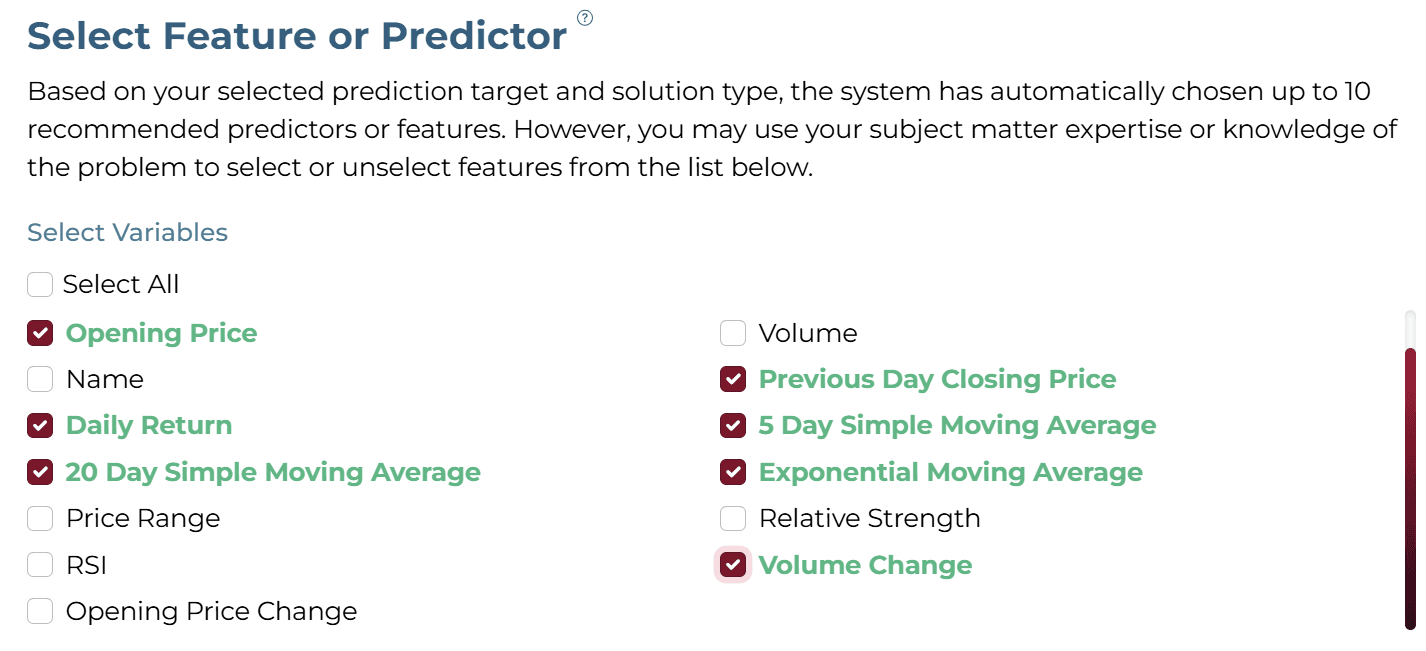
DSelecting Features
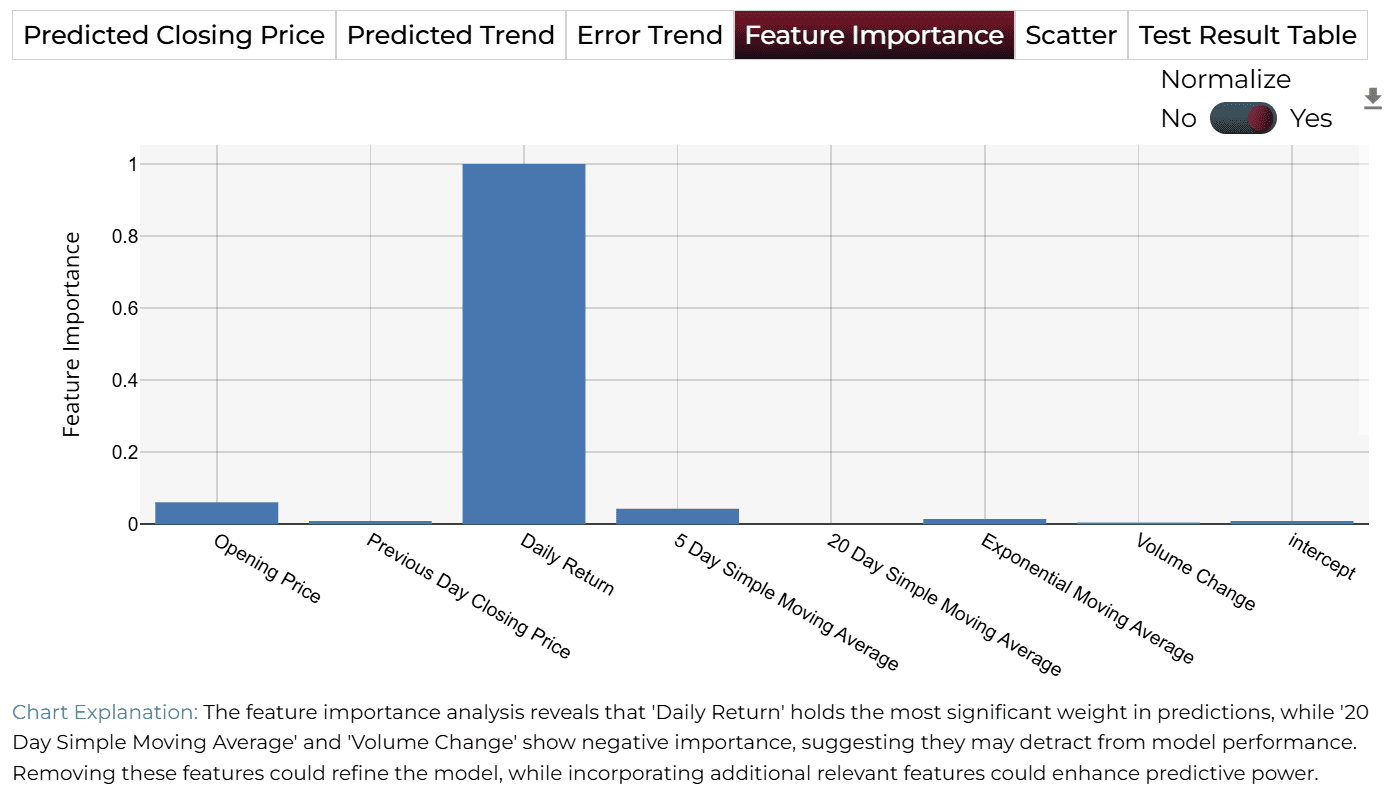
Select Opening Price, Daily Return, SMA, EMA, and Volume Change.
ESelecting Training Level

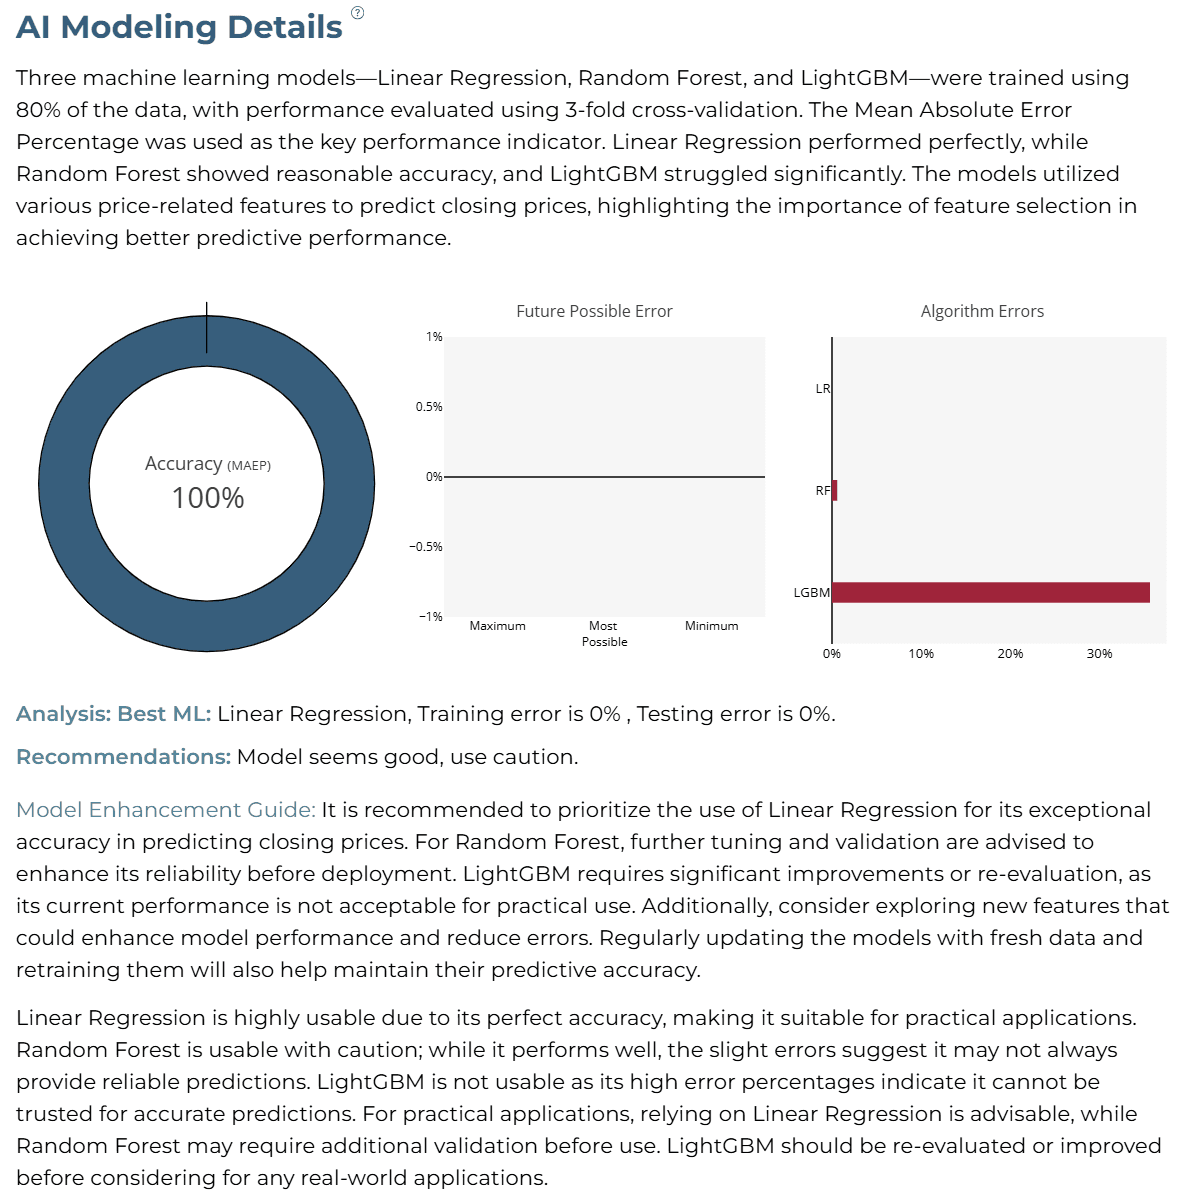
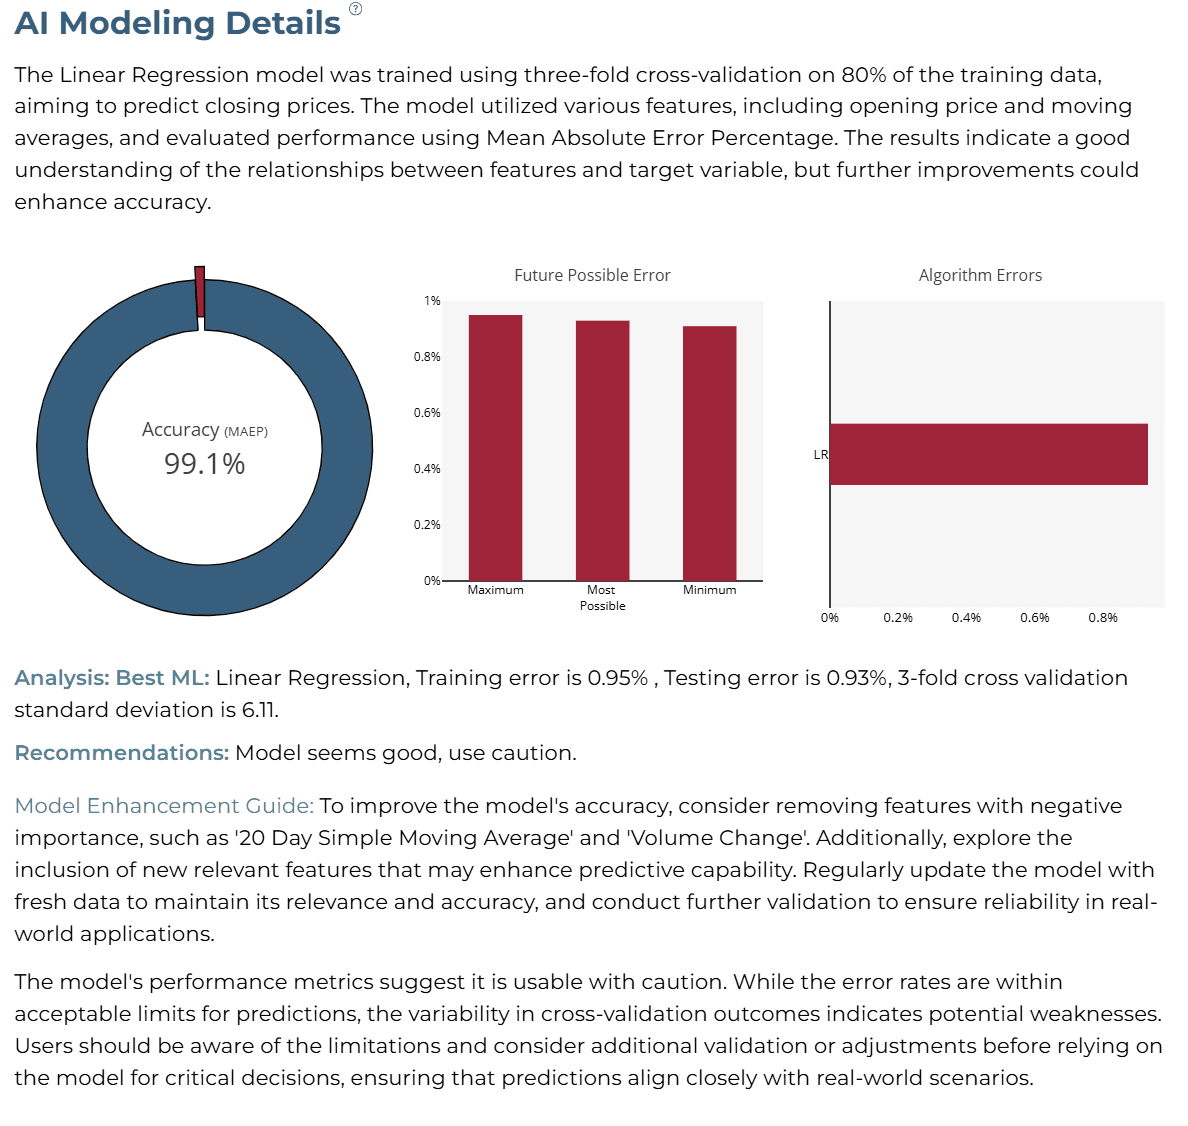
AI Modeling Details
Linear Regression achieved an accuracy of 99.1% with a testing error of 0.93% using 3-fold cross-validation.
Training Analysis Details
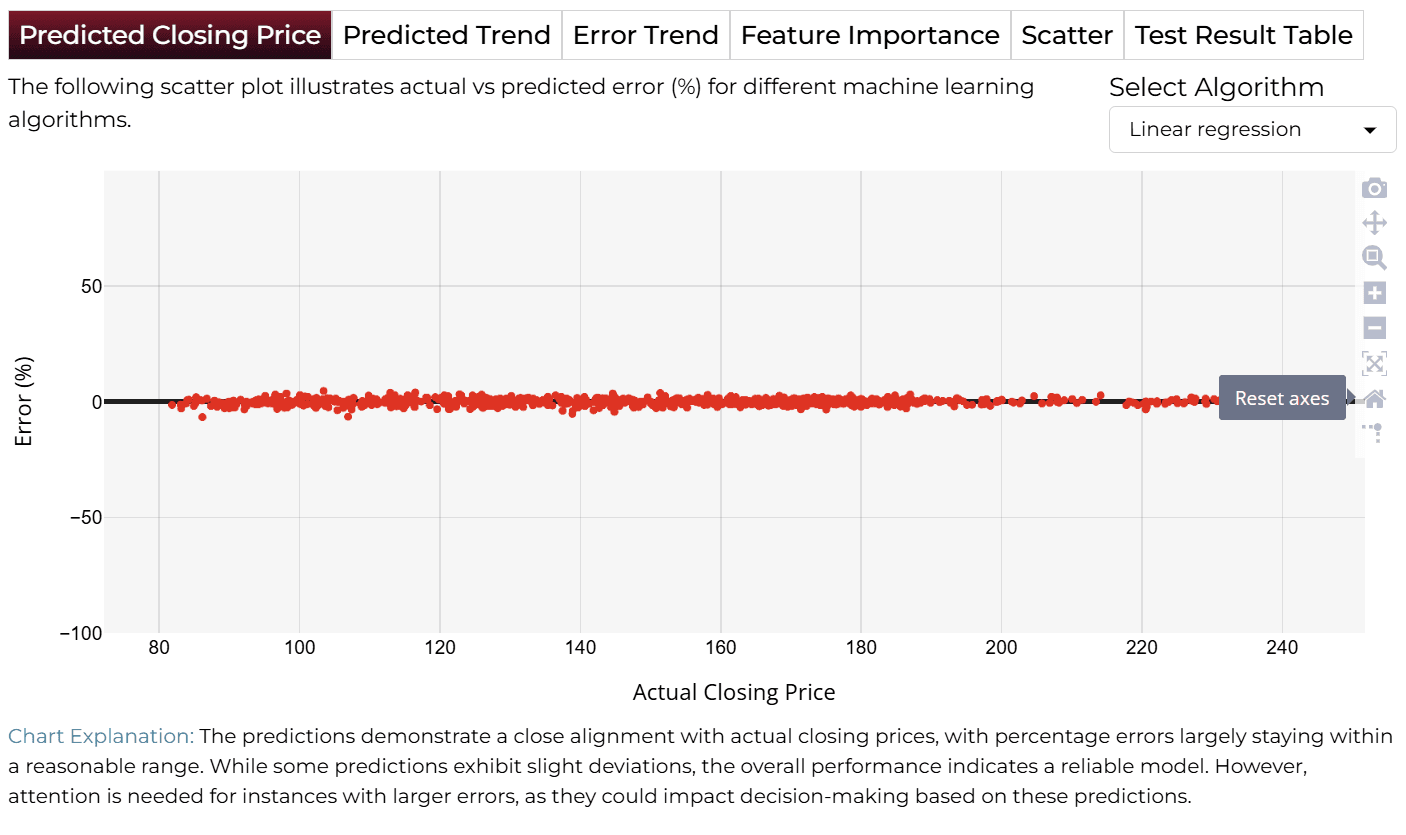
APredicted Closing Price
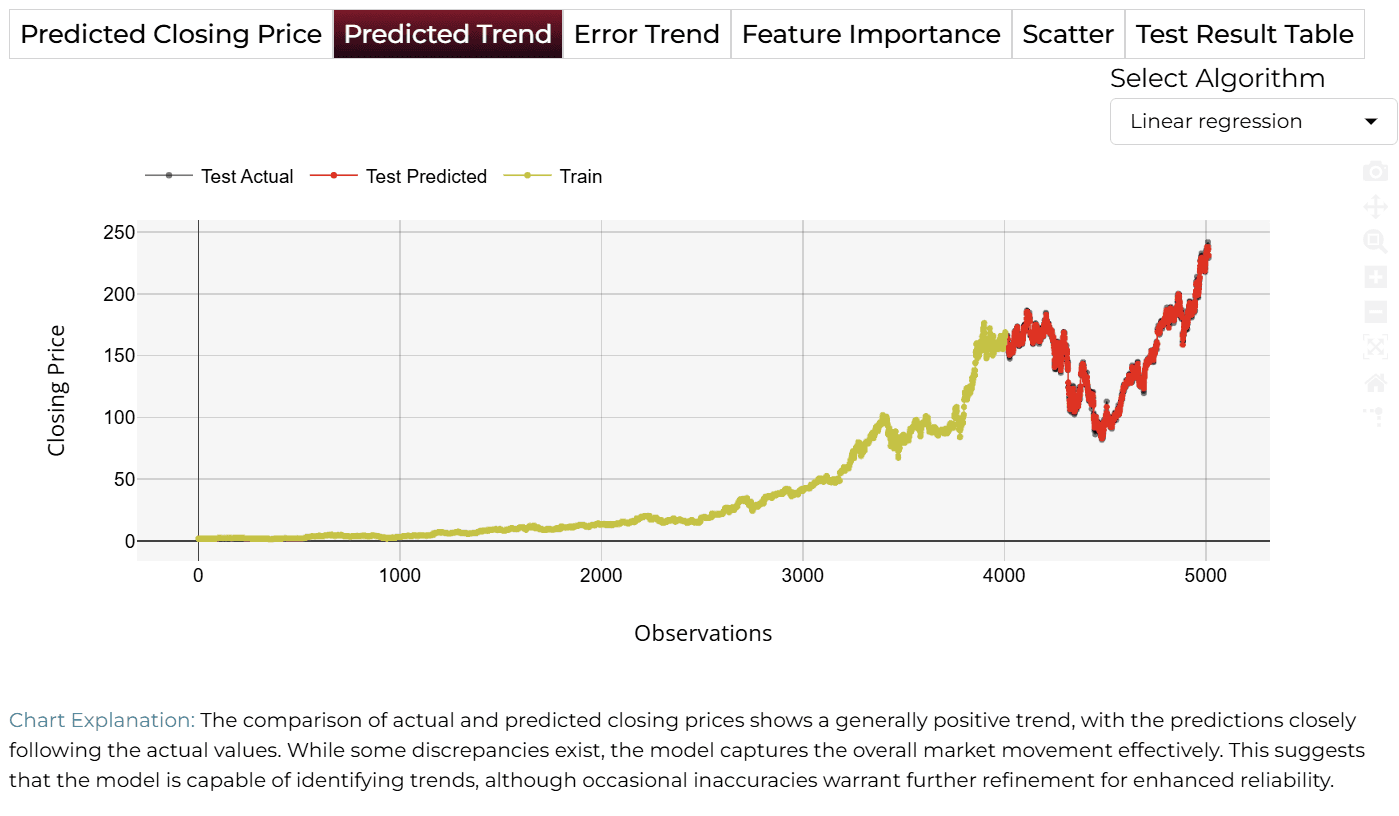
BPredicted Trend
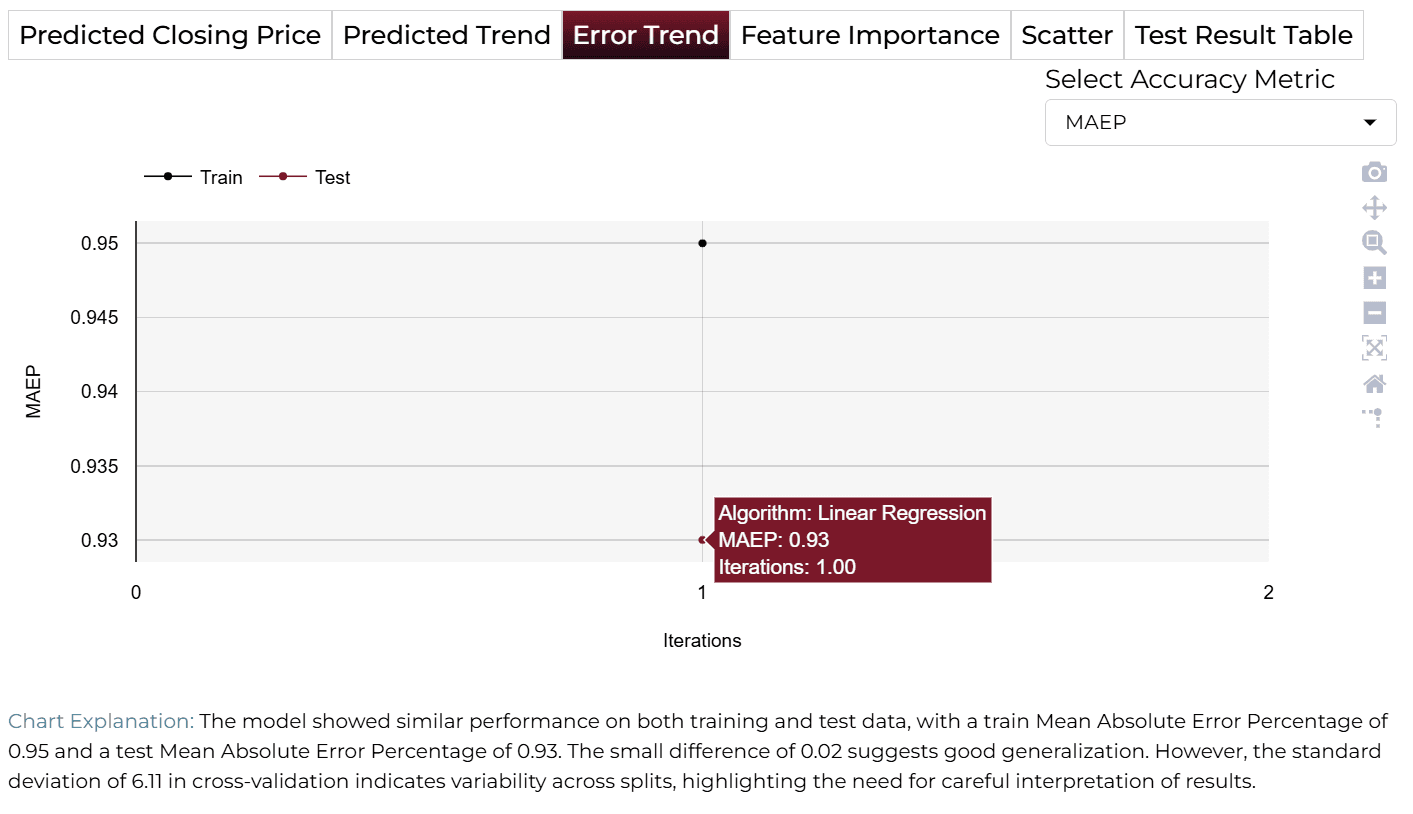
CError Trend
DFeature Importance
Finalize Models
Once satisfied with performance, click 'Deploy'. The system saves and deploys models for future demand analysis or production environment.

4AI APPLICATION
Manual Model Building
In Manual Training Mode, users can modify sliders for variables like Daily Return and Previous Day Closing Price. Clicking ‘Get Response’ triggers an updated closing price prediction.
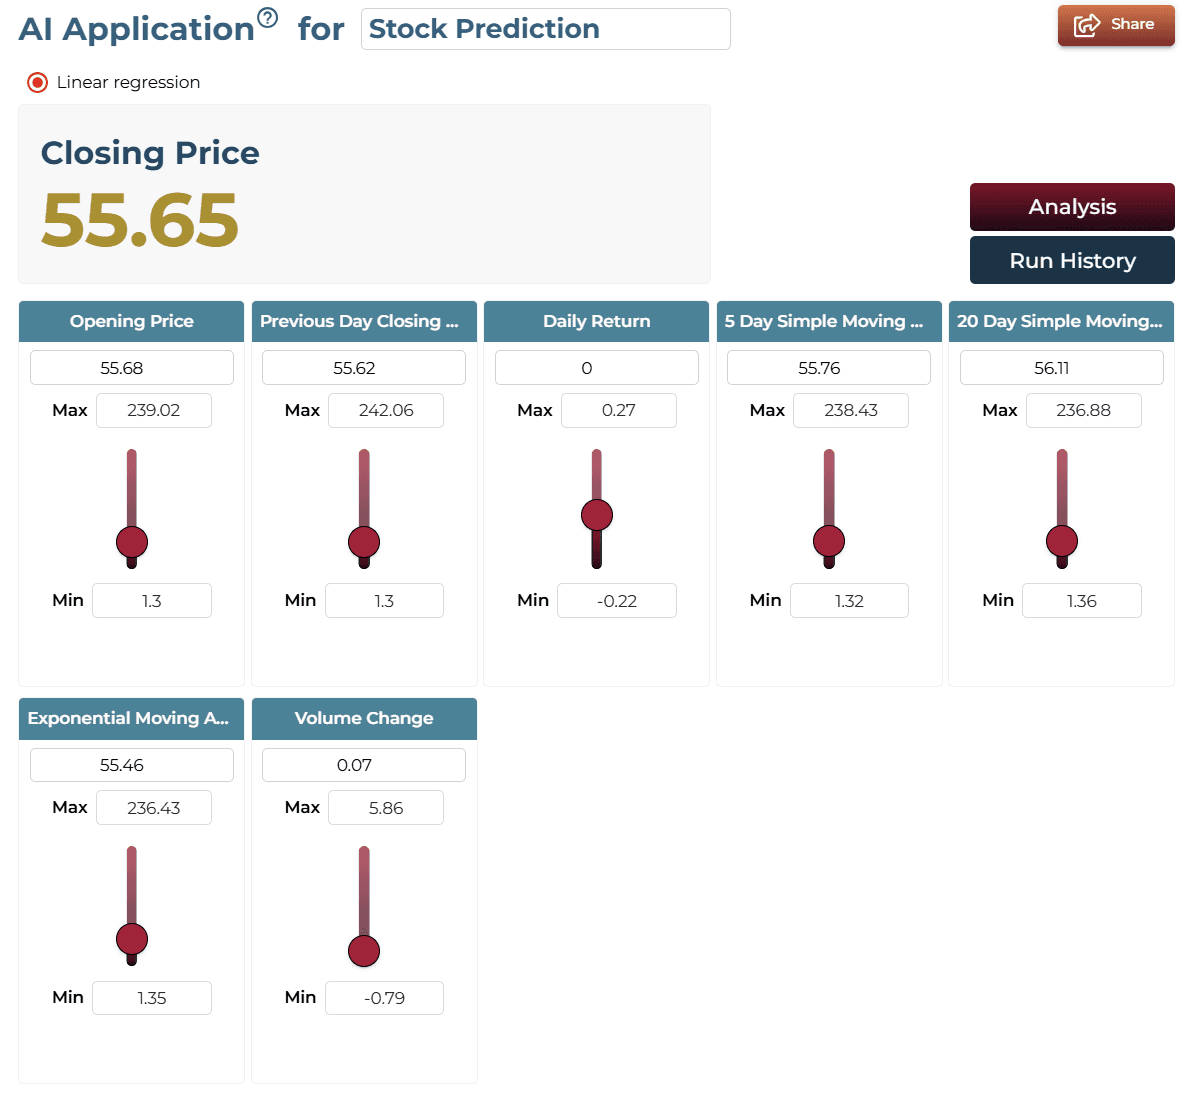
AI Application Demo
- Adjust financial indicators like Daily Return and Opening Price.
- Observe how these changes impact the predicted closing price in real-time.
Saving the Project
Save your project by clicking the icon at the bottom left corner of the textbox.

Sharing the Project
Share the application for single on-demand predictions once the analysis is saved.

Interested in similar AI solutions?
Explore our full suite of AI capabilities designed to transform your business operations.