

Predicting the Rate of Violent Crimes in Neighborhoods
Predicting the number of murders per 100K people in communities based on demographic information.
1Overview & Strategic Importance
Problem Statement
Crime is a major concern in many urban and rural areas, influencing public safety, socio-economic conditions, and policy decisions. Violent crimes, including murder, assault, and robbery, have far-reaching consequences that impact the well-being of individuals and communities. Understanding the factors that contribute to violent crime rates can help in devising effective crime prevention strategies.
Various factors such as socio-economic status, education levels, employment rates, police presence, and demographic composition can influence crime patterns. By analyzing these relationships, it is possible to build predictive models to assess the likelihood of violent crimes occurring in different regions.
Required Solutions
- Analyze how socio-economic, demographic, and law enforcement factors influence crime rates.
- Identify key indicators of crime to predict high-risk areas.
- Assist policymakers and urban planners in developing proactive reduction strategies.
Solution Objectives
- Perform EDA to identify trends and correlations in crime data.
- Build a machine learning model to predict violent crime rates.
- Develop an AI app for scenario-based risk assessment.
Understanding the Problem
Violent crime poses a significant challenge to law enforcement and communities. Traditional strategies rely on historical data, but ML techniques provide a more nuanced understanding of dynamics.
Analyzing large datasets containing socio-economic and law enforcement variables helps in predicting rates with high accuracy and implementing better-targeted programs.
2About the Data
Data Collection
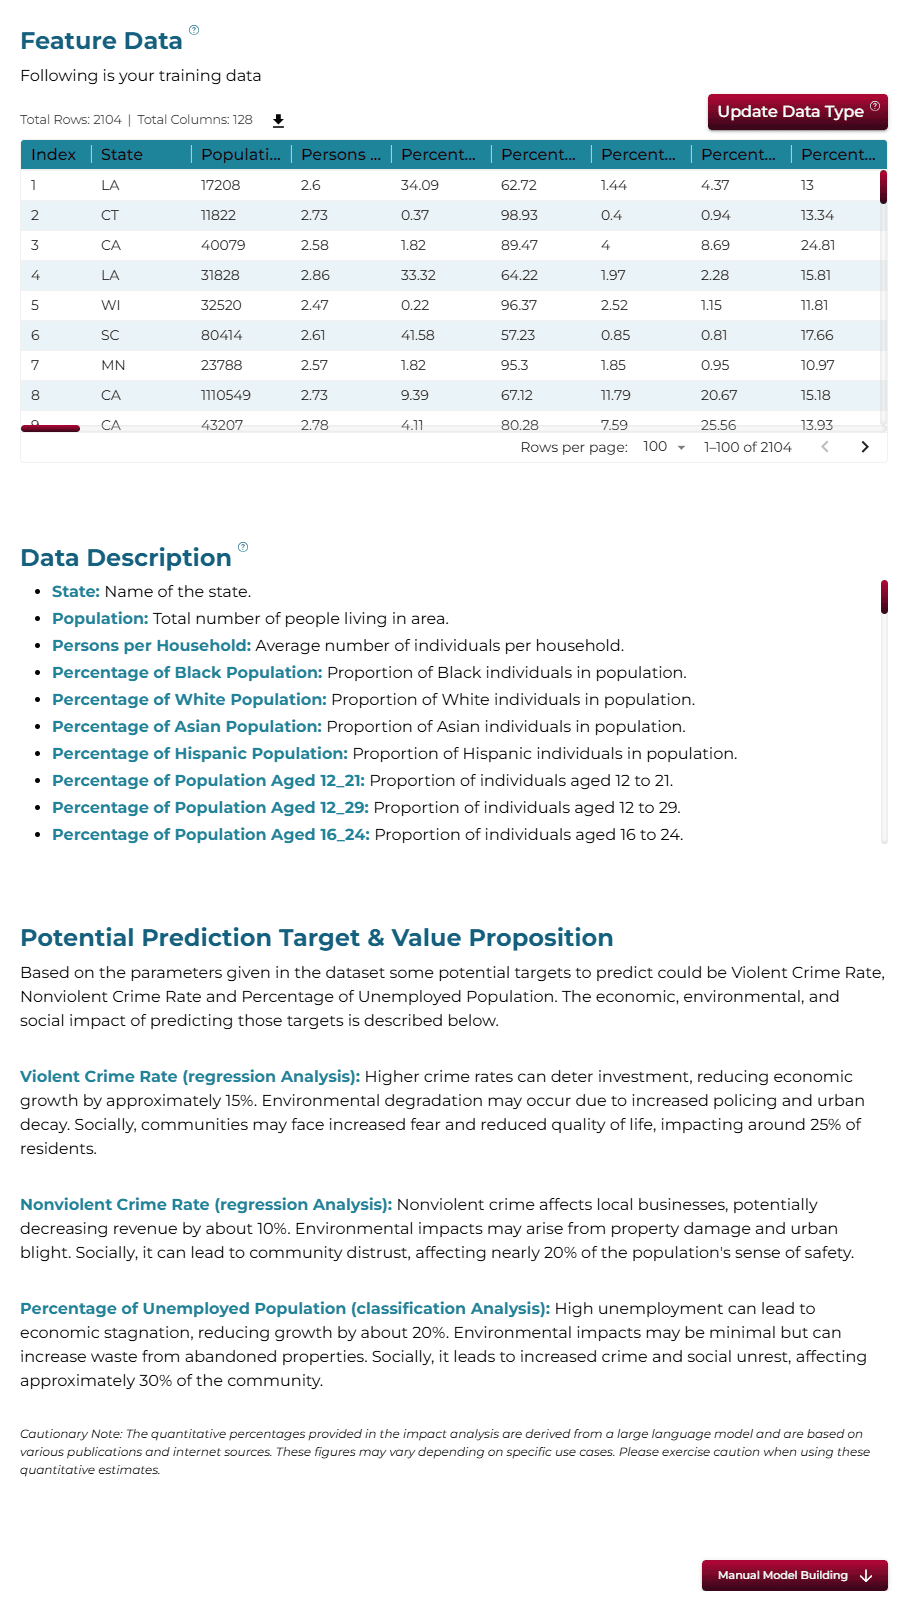
The 'Communities and Crime' dataset from the UCI Machine Learning Repository provides an opportunity to test societal notions regarding race and crimes. It includes 122 attributes picked if there was any plausible connection to crime, dating back to 1990 and 1995.
Major Parameters Description
Download Training DataStateThis feature represents the state where the data was collected.
PopulationTotal number of people living in the area.
Persons per HouseholdAverage number of persons living in each household.
Percentage of Black PopulationPercentage of the total population that is Black.
Percentage of White PopulationPercentage of the total population that is White.
Percentage of Asian PopulationPercentage of the total population that is Asian.
Percentage of Hispanic PopulationPercentage of the total population that is Hispanic.
Percentage of Population Aged 12-21Percentage of the population between ages 12 and 21.
Percentage of Population Aged 12-29Percentage of the population between ages 12 and 29.
Preprocessing Steps
- Renaming the columns for clarity.
- Removing columns for other crime rates (murders, arson) as they won't be available during prediction.
3Using iDareAI
Guided Mode Initialization
AUploading Dataset
Click on the **'Upload CSV or Excel Data'** button → Select a source for the dataset → Upload `crime_rate_train.csv`. The system automatically analyzes the file, extracts column descriptions, and identifies the top value-adding targets for prediction.
BChoosing Analysis Mode
- What is the expected violent crime rate based on the provided data?
- What factors contribute the most to violent crimes in this dataset?
Operation Using Autonomous Guided Mode
AQuery Response
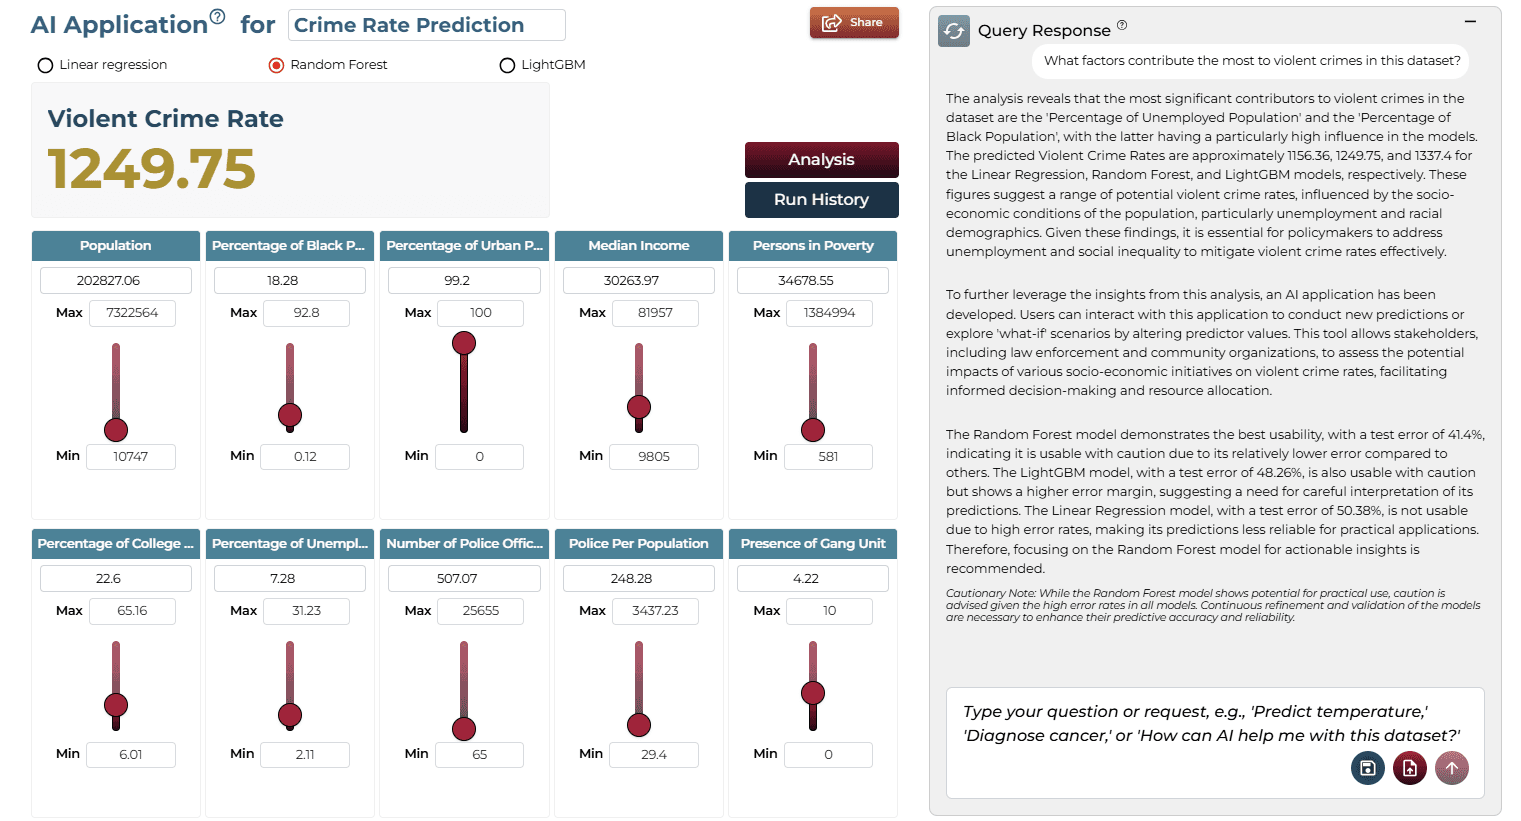
"The analysis reveals that the most significant contributors to violent crimes are 'Percentage of Unemployed Population' and 'Percentage of Black Population'. Random Forest demonstrated the best usability with a 41.4% test error."
BAI Application
Running the query generates an on-demand AI application. Users can adjust sliders for socio-economic variables and see real-time updates to predictions.
Model Fine-Tuning/Manual Model Building
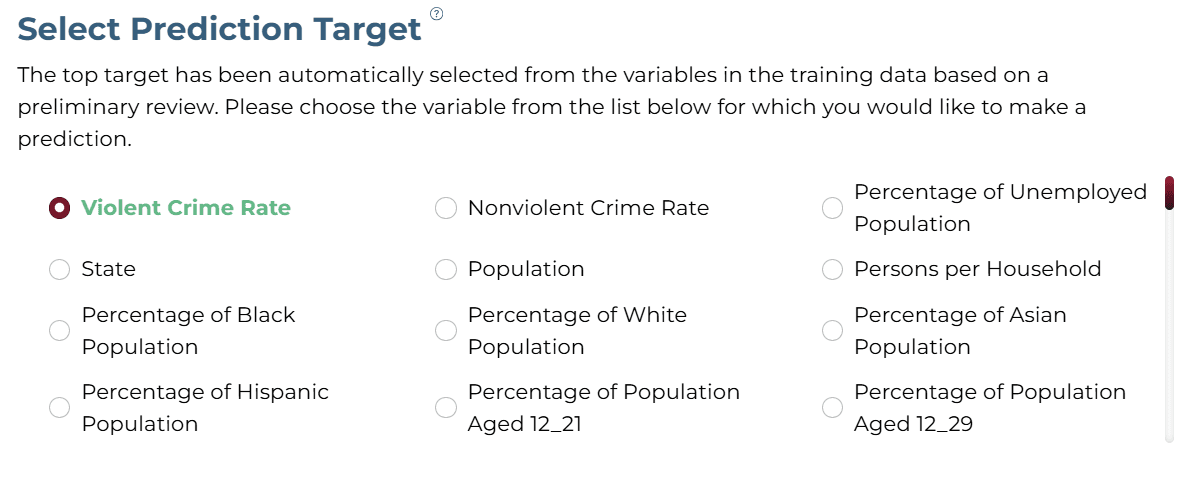
ASelecting Prediction Target
'Violent Crime Rate' was selected as the target column.
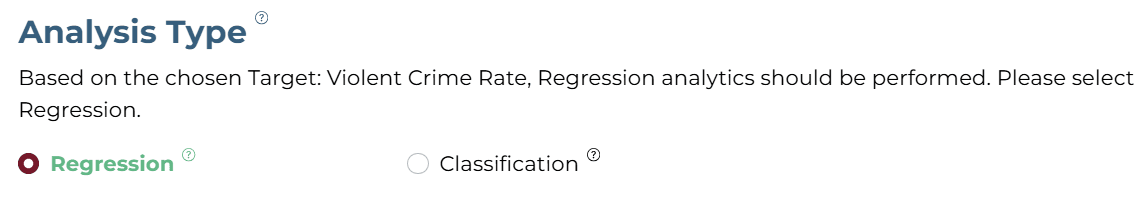
BSelecting Analysis Type
Since the target is numeric, 'Regression' is automatically suggested.
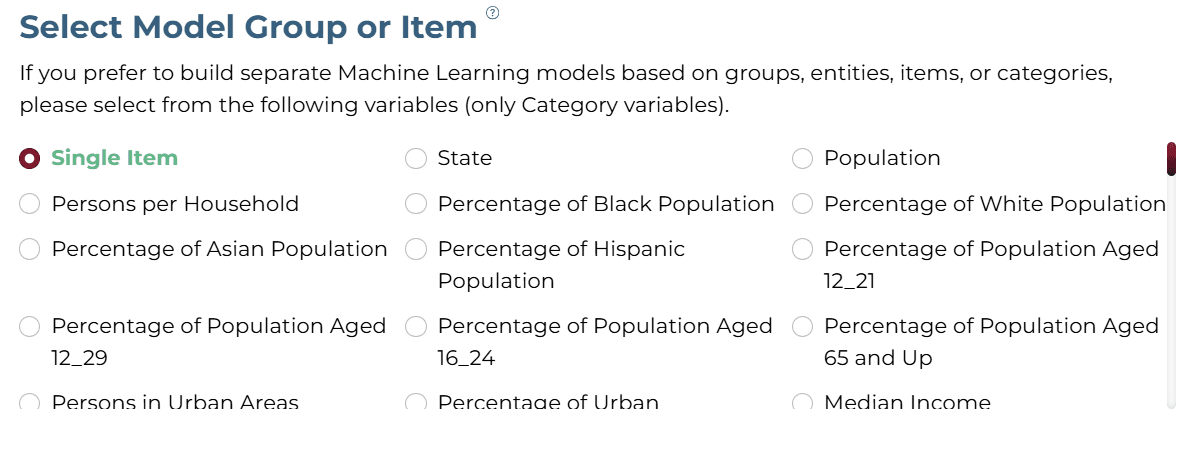
CSelecting Model Group/Item
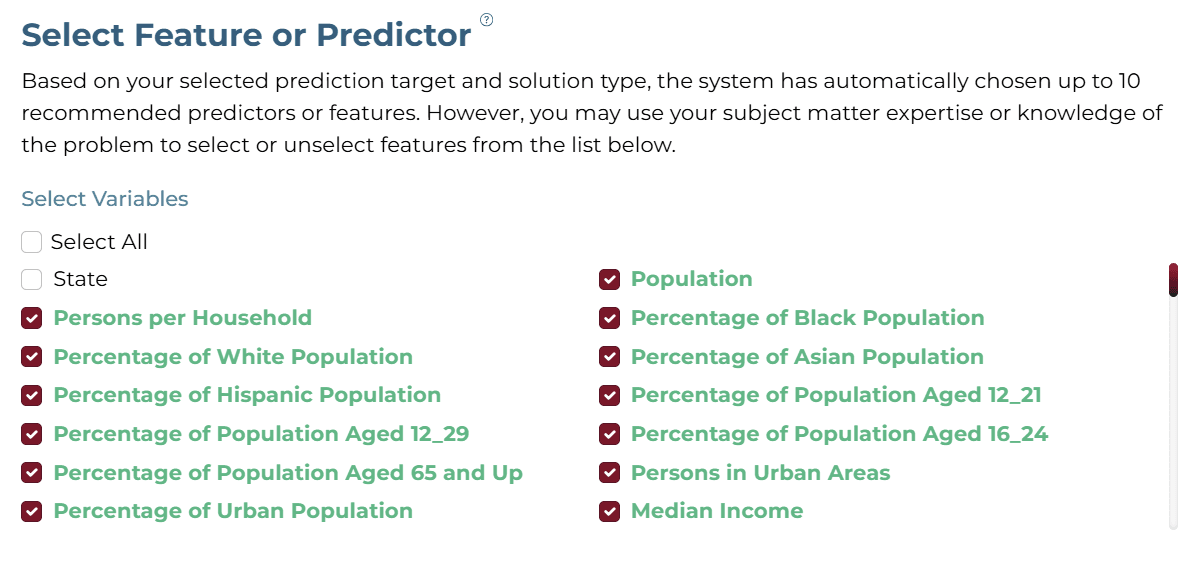
DSelecting Features
Uncheck 'State' and other irrelevant variables. Focus on socio-economic indicators.
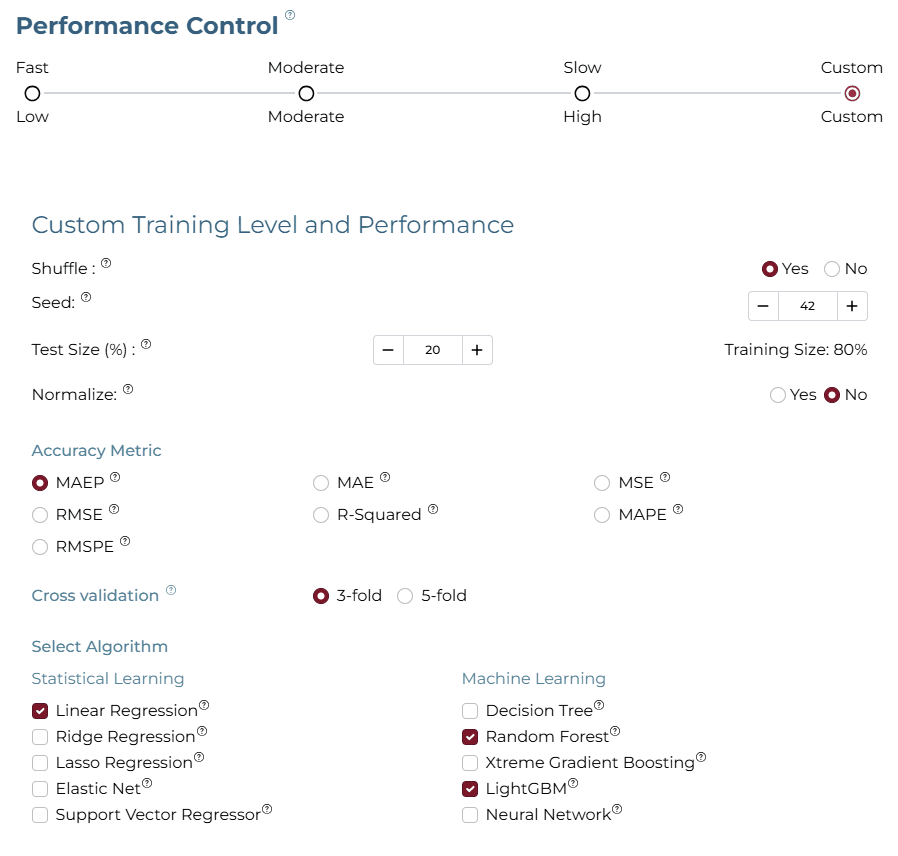
ESelecting Training Level
Selected Linear Regression, Random Forest, and LightGBM with 3-fold cross-validation.
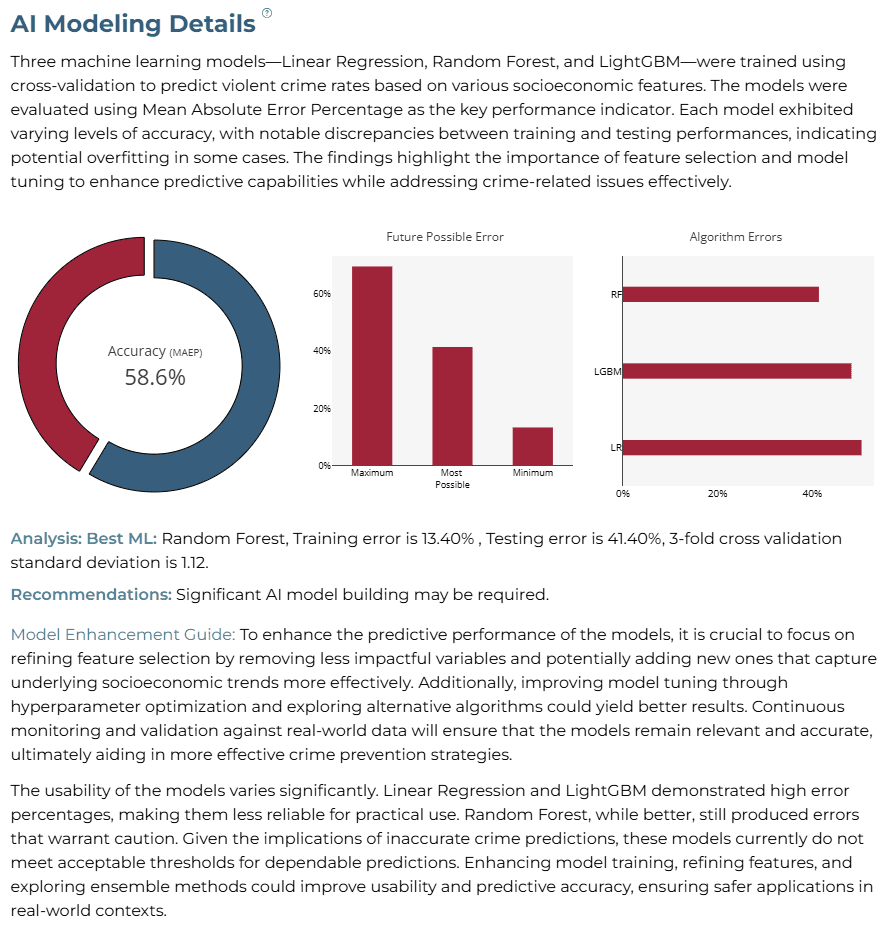
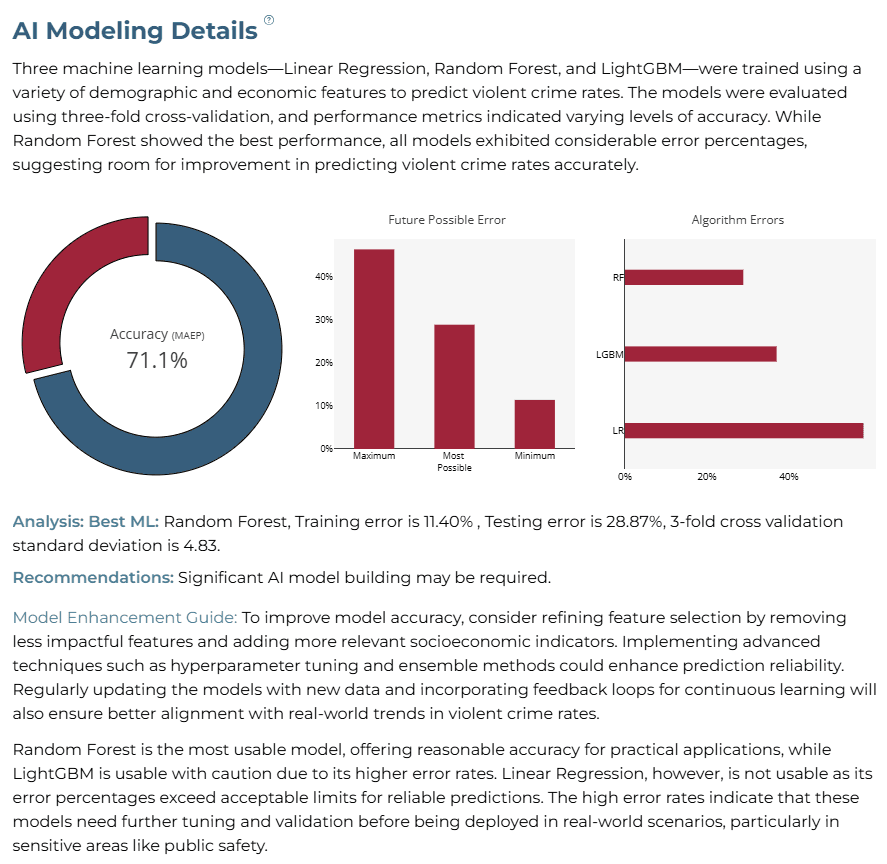
AI Modeling Details
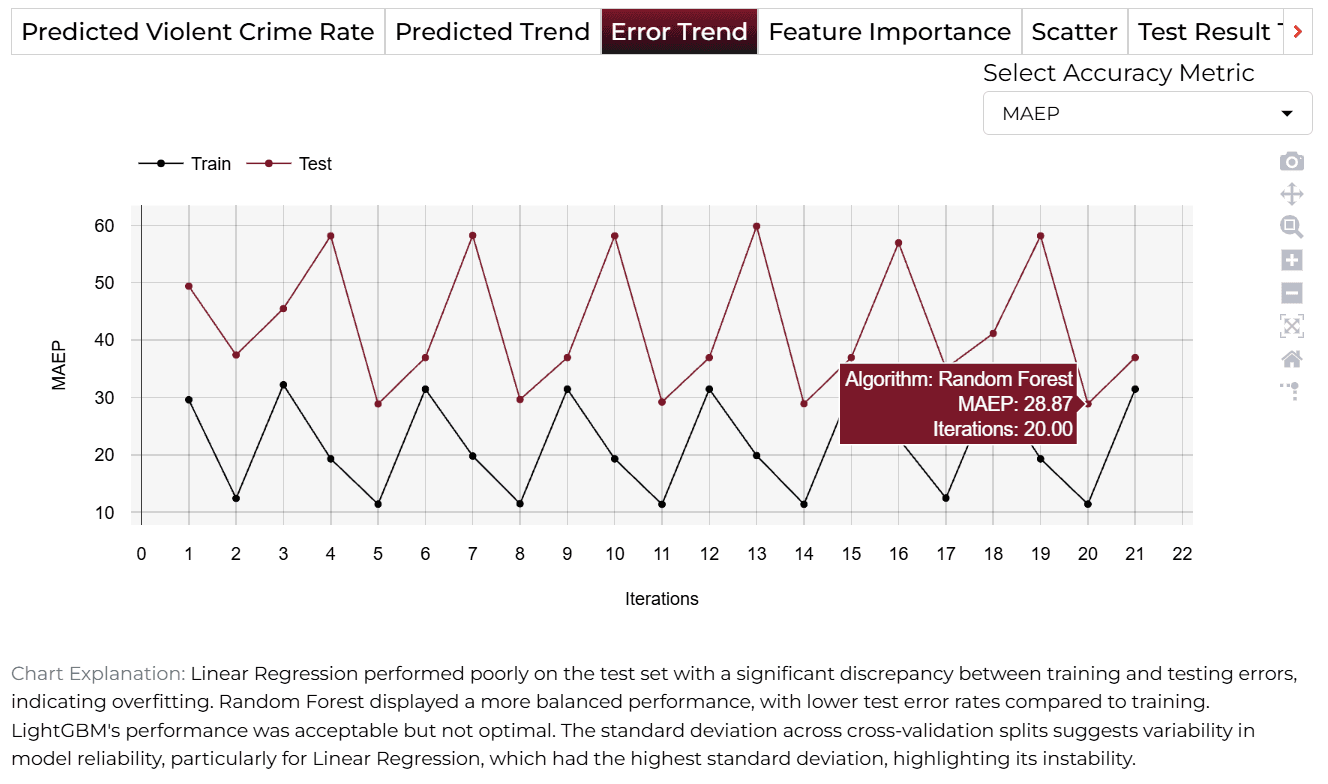
Random Forest performed best with 28.87% test error. Linear Regression was less reliable due to high error rates exceeding acceptable thresholds.
Training Analysis Details
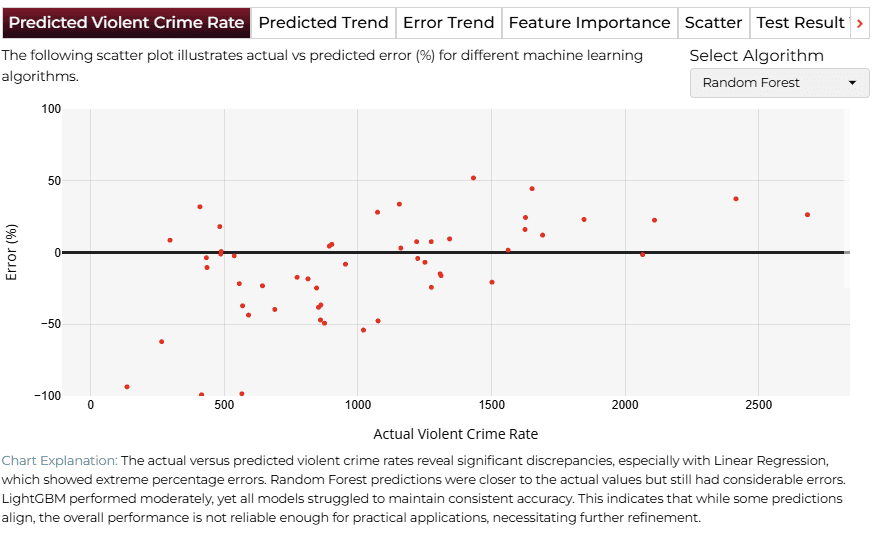
APredicted Violent Crime Rate
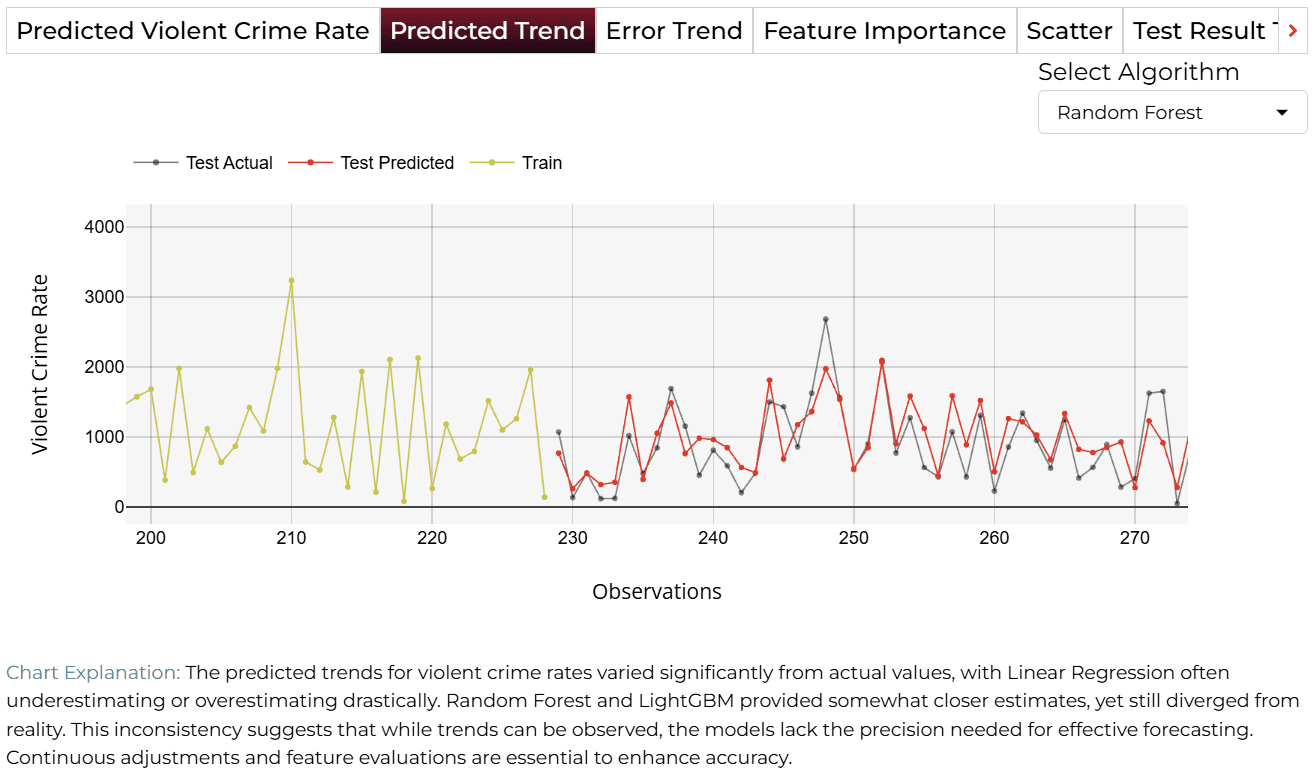
BPredicted Trend
CError Trend
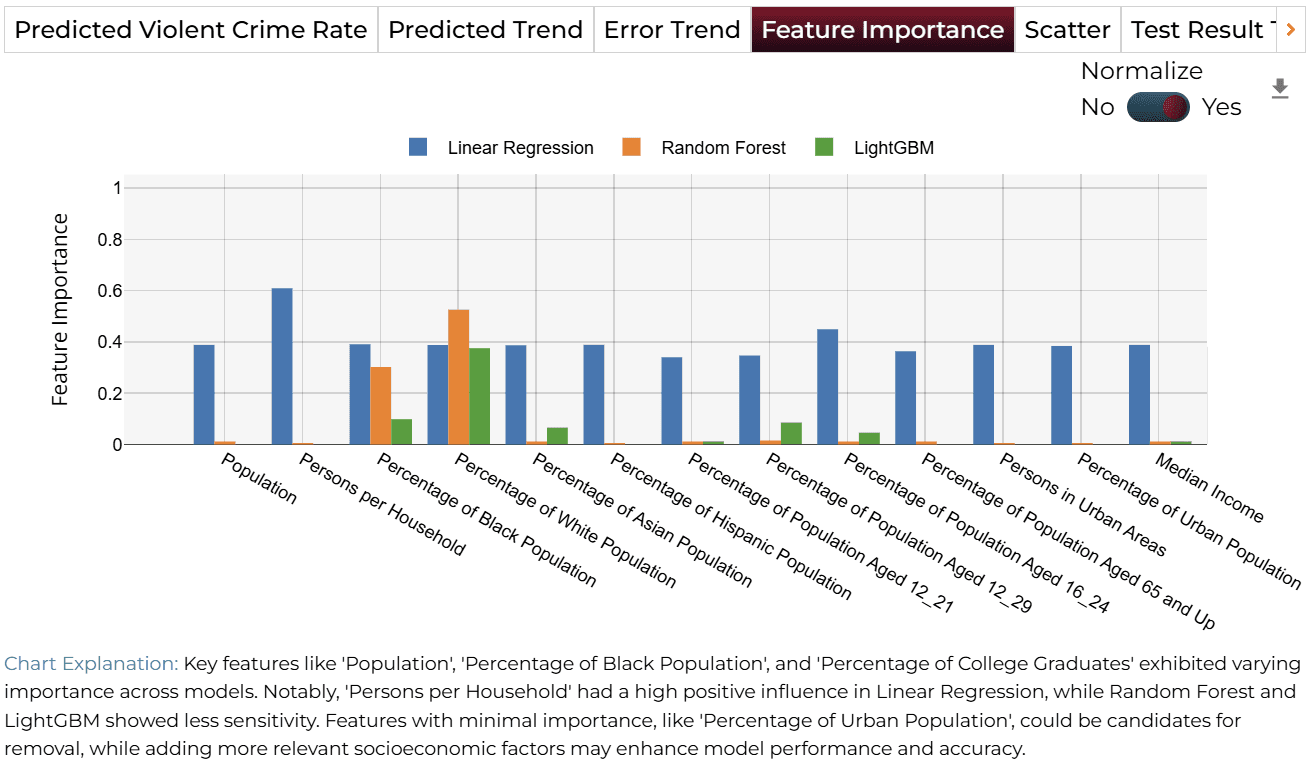
DFeature Importance
Finalize Models
Once satisfied with performance, click 'Deploy'. The system saves and deploys models for future demand analysis or production environment.

4AI APPLICATION
Manual Model Building
In Manual Training Mode, users can modify sliders for socio-economic variables. Clicking ‘Get Response’ triggers an updated analysis.
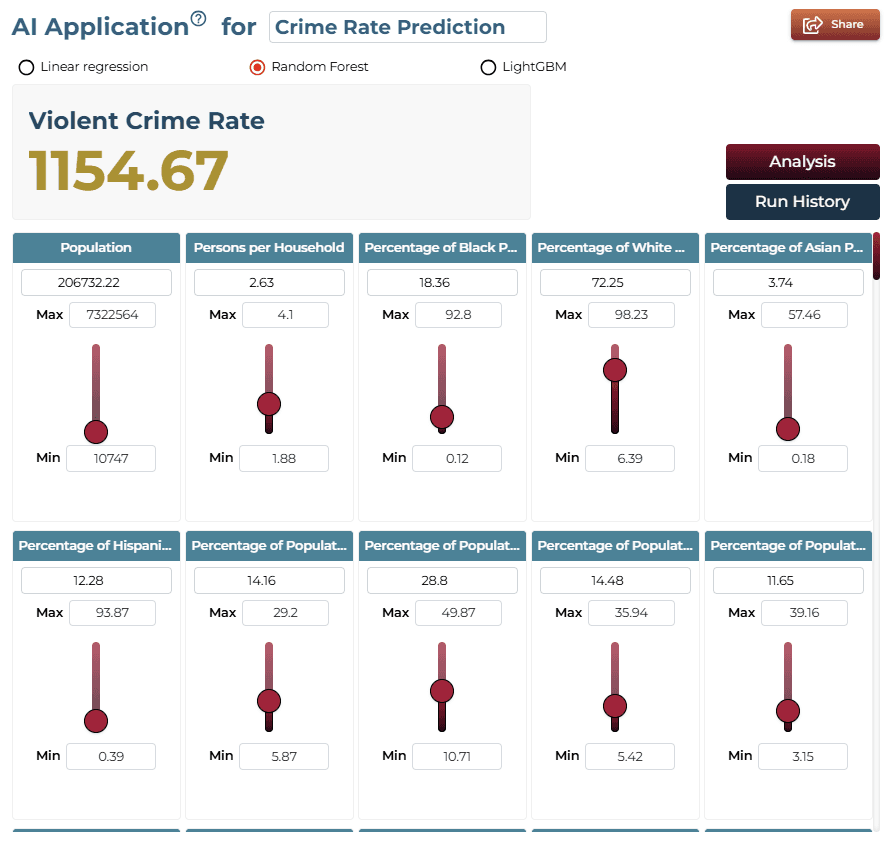
AI Application Demo
- Initial states represent baseline for predicted violent crime rate.
- Using sliders, adjust 'Population' or 'Income' values.
- The predicted rate updates instantly based on shifts.
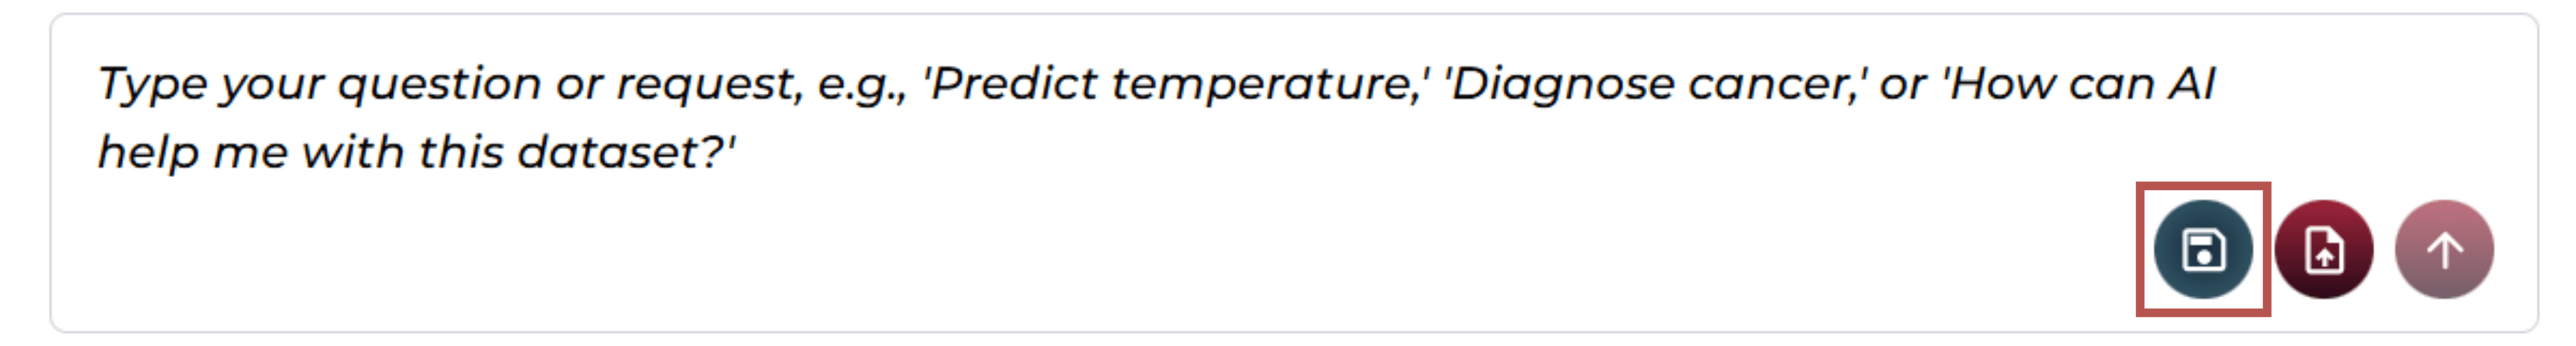
Saving the Project
Save your project by clicking the icon at the bottom left corner of the textbox.
Sharing the Project
Share the application for single on-demand predictions once the analysis is saved.

Interested in similar AI solutions?
Explore our full suite of AI capabilities designed to transform your business operations.